An analytical dashboard is a visual display of the most important metrics and KPIs for a business.
By tracking these metrics regularly, businesses can identify trends and make better decisions about where to focus their efforts.
Analyzing an analytical dashboard is easy compared to digging through raw data, understanding it is worth the effort to get it right.
In this blog post, we’ll see how an analytical dashboard can help in making better decisions for your business.
Here are the topics that we will cover in this blog:
- What is an analytical dashboard?
- Why do you need an analytical dashboard?
- Who uses an analytical dashboard?
- 6 Key types of analytics dashboard
What is an analytical dashboard?
An analytical dashboard is a user interface of the dashboard that contains metrics with analytical insights for analysis to understand qualitative and quantitative data.
An analytical dashboard contains immense number of data in an understandable and interactive analytics.
With an analytical dashboard you can reveal patterns, compare them to multiple variables and data, to make assumptions.
The only goal of setting an analytical dashboard is to make business strategies and take data-driven decisions.
Bulk raw data is combined and visualized as metrics into colorful charts and digits.
An analytical dashboard is always built with data collected about past events and circumstances relative to a particular subject.
Why do you need an analytical dashboard?
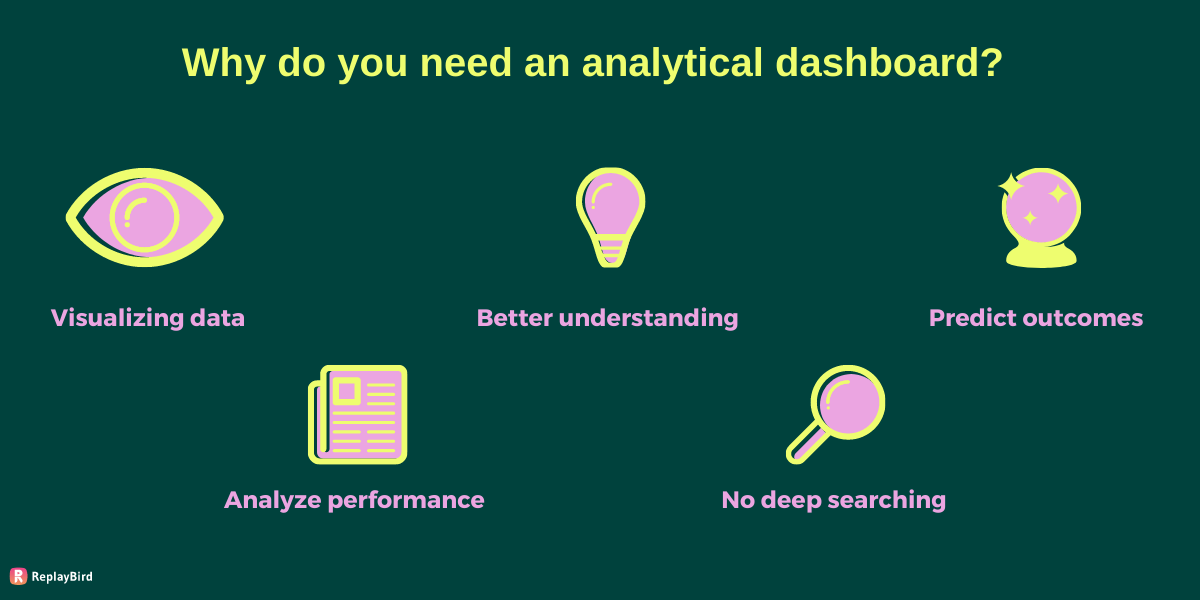
#1 Visualizing data
Visualizing data helps with reducing noise from big data and spotlights trends and potential insights.
Data visualization can be used to create real-time reports of performance metrics, which can be invaluable for keeping track of progress and identifying areas for improvement.
Data visualization can also be used to create visually appealing and easy-to-understand infographics, which can be used to communicate complex data sets to a wide audience.
#2 Better understanding
An analytical dashboard can be used to better understand how things are affected by different events.
An analytical dashboard helps us to make better decisions, both as individuals and as a society.
There is no necessary learn any skill or deep knowledge to understand the most of data.
#3 Predict outcomes
An analytical dashboard provides historical data.
With regular frequency activities and actions at regular intervals and repeated performance outcomes, one can easily predict outcome.
The exact example can be share market analytics, some investors are able to predict the rise and fall of the share in the share market with an analytical dashboard and prior historical data outcomes.
#4 Analyze performance
With an analytical dashboard it is easier and simpler to analyze the performance of the work.
Optimizing and improvising definitely needs an analytical dashboard to know where and why to optimize.
#5 No deep searching
Raw data is hard to understand sometimes they are impossible to understand, whereas an analytical dashboard reads and visualizes as understandable metrics and trends.
You don't have to dig deeper into texts, or numerical data.
Who uses an analytical dashboard?
The unarguable opinion is an analytical dashboard that can be used by anyone who wants to understand the historical data to improvize and optimize.
Yet these an analytical dashboard are built to have major target towards specific roles and professions who has to be rebenefited with the analytical dashboard
#1 CMOs & Marketing Executives
Marketing is about reaching the right audience with the right message and converting them at a high rate.
To do this, marketers need lots of data about their customers, their prospects, their marketing campaigns, and more.
This data can be overwhelming, but it doesn't have to be.
Dashboards can help you make sense of all your data and give you the insights you need to make decisions that will grow your business.
There are many different types of dashboards, but not all of them are created equal.
#2 Sales managers and teams
Any business relies on the sales process, and an analytical dashboard can provide the insights required to optimize results.
Businesses can identify areas of opportunity and make changes to improve outcomes by tracking sales data and analyzing trends.
An analytical sales dashboard can provide a wealth of data about a company's sales process, such as conversion rates, average deal size, and win rates.
This information can be used to identify opportunities and make changes to improve outcomes.
Businesses can make data driven decisions about their sales process with the right data, which can lead to increased sales and better results.
#3 CFOs & Finance Executives
Cfos have always been concerned with ensuring the financial health of their company and making sound decisions based on accurate data.
This is more important than ever in today's business environment.
Real-time data and analytics are essential for making informed decisions quickly.
An analytical dashboard can give finance executives access to all of the data they need in one place, in real time.
This can help them make better decisions more quickly.
It should be simple to use and customizable so that it can be tailored to the organization's specific needs.
Finance executives can benefit from a well-designed analytical dashboard.
It can assist them in making better, more timely decisions based on accurate data.
#4 Product Managers and teams
Product managers are always looking for ways to optimize their product development process and team productivity.
Product analytical dashboards can be a useful tool for identifying areas of improvement and tracking progress over time.
There are a variety of product analytical dashboards available, each with its own strengths and weaknesses of the product.
With a product analytical dashboard, you can see how your team is performing, what areas need improvement, and where you can make changes to improve efficiency.
#5 Customer officer and support team
One of your primary responsibilities as a customer officer or support team member is to ensure that customers are satisfied with your company's products or services.
This requires the ability to effectively analyze customer feedback.
An analytical dashboard can be a useful tool in assisting you with this.
It can give you information about customer sentiment, how customers use your products or services, and where you can improve.
An analytical dashboard is a tool that can help you collect and analyze data about your customer support process.
An analytical dashboard can help you track customer satisfaction levels, response times, and more.
With this information, you can identify areas of improvement and make changes to your process to help your team be more successful.
6 Key types of analytics dashboard
Here are 6 key and major analytical dashboards that your business and your teammates may need to improve your business from all aspects.
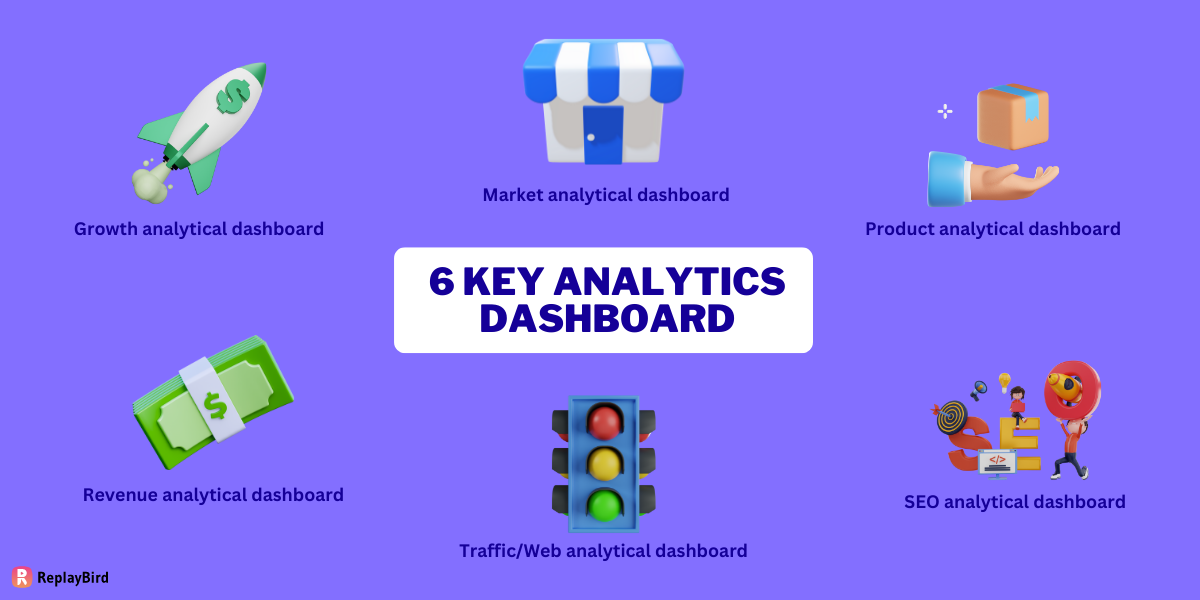
#1 Growth analytical dashboard
A growth analytical dashboard enables you to track and analyze your company's growth performance as well as its scalability constantly and reliably over time.
Growth analytical dashboard provides real-time information about the number of prospective consumers, reactivations, upgrades, downgrades, churn, MRR, and ARR earned by your company over a specific time period.
With the growth analytical dashboard, you can make better business decisions, communicate your company's value to customers and investors, and identify improvements.
Here are some of the growth analytical dashboard metrics:
- Net profit
- Gross profit
- New customers
- Income
- MRR
#2 Marketing analytical dashboard
Marketing analytical dashboard provides insights on improving the and analyze the conversion and expanding market.
Marketing analytical dashboard enables teams to improve and monitor campaign ROI and performance in real time.
You can customize Marketing analytical dashboard in respect to each role , so that they have their own set of performance metrics.
Companies can also, recognize issues quickly and capitalize on successes.
Here are some of the marketing analytical dashboard metrics:
- Leads generated
- Sales leads
- Conversion rate
- Revenue
- Return on Investment
- Website traffic
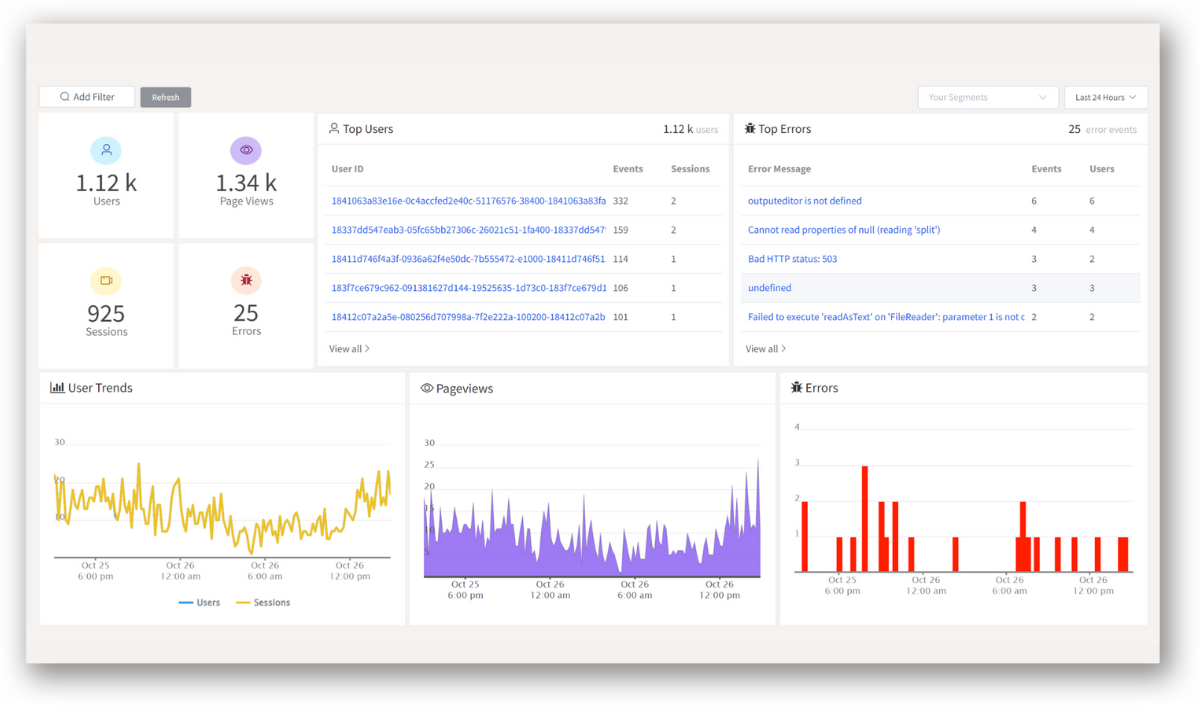
#3 Product analytical dashboard
A product analytics dashboard is built for product managers and product teams to determine the performance of a product or functionality by displaying specific product management KPIs to give an errorless user experience.
You can analyze your product with ReplayBird, the best product analytics let you understand and improvize your digital product
Here are some of the product analytical dashboard metrics:
- Page views
- User trends
- Error trends
- Conversion rate
- Retention rate
- Browser Breakdown
- Click rate
- User frustrations
Read More: 10 Best Product Analytics Tools for Product Managers and Teams
#4 Revenue analytical dashboard
Revenue Analytical Dashboard is built for CFOs and chief executives, and financial teams to use financial data and analyze company revenue performance and to easily track trends and variances in the company's income.
This type of dashboard's key functionality displays the trend in total revenue as well as the overview into major revenue categories such as product sales and services.
Studying revenues through revenue analytical dashboard, companies are enabled to boost and improve its executives' insights while also decreasing the chances that managers will miss important trends.
Here are some of the revenue analytical dashboard metrics:
- Monthly revenue
- Product revenue
- Yearly revenue
- Return on ad spend
- Average profit margin
- Lifetime customer value
- Average order value
- Assisted revenue
- Customer acquisition cost
#5 Traffic/Web analytical dashboard
Website analytics helps in the analysis of website visitor behavior.
This is the process of collecting, analyzing, and reporting data in order to measure web activity, which includes the requirement for a website and its components such as webpages, photos, and videos.
Data from web analytics could include traffic sources, referring sites, page views, paths taken, and conversion rates.
The information gathered is frequently used in customer relationship management analytics to help and streamline better business decisions.
Web analytics enables a business to retain customers, attract new visitors, and increase the amount of money each customer spends.
Here are some of the Traffic/Web analytical dashboard metrics:
- Top webpages viewed
- Referrers
- User Countries
- User Devices
- Use OS
- Wepage Errors
- Browser Breakdown
Read More: 12 Top Easy Web Analytic Tools - Features and Price Comparison
#6 SEO analytical dashboard
SEO Analytical Dashboard also comes under marketing analytical dashboard, but in this era SEO analytical dashboards play a major role in digital businesses.
SEO Analytical Dashboard is a repository for all of your web ranking analytics data.
An SEO Analytical dashboard serves as a central gathering point for all of these data sources, allowing digital marketers to gain a comprehensive understanding of SEO performance through metrics.
SEO metrics and key performance indicators (KPIs) are results used by marketing teams to evaluate the ranking of their website in organic search results.
Any marketing team's primary purpose is search engine optimization.
Teams can measure SEO metrics and track changes on a regular basis.
This analysis can assist in determining top performing pages, top converting keywords, and areas of your website that require search optimization.
- External links
- Indexed pages
- Internal/External links per page
- Keyword density per page
- Keywords rankings
- Mobile friendly score
- Organic Traffic
- Pages generating maximum traffic
- Page load time and more
Conclusion:
Here is a recap of a key analytical dashboard blog:
What is an analytical dashboard?
- An analytical dashboard is a user interface of the dashboard that contains metrics with analytical insights for analysis to understand qualitative and quantitative data.
Why do you need an analytical dashboard?
- Visualizing data
- Better understanding
- Predict outcomes
- Analyze performance
- No deep searching
Who uses an analytical dashboard?
- CMOs & Marketing Executives
- Sales managers and teams
- CFOs & Finance Executives
- Product Managers and teams
- Customer officer and support team
6 Key types of analytics dashboard
- Growth analytics dashboard
- Marketing analytics dashboard
- Product analytics dashboard
- Revenue analytics dashboard
- Traffic/Web analytics dashboard
- SEO analytics dashboard
ReplayBird - Driving Revenue and Growth through Actionable Product Insights
ReplayBird is a digital experience analytics platform that offers a comprehensive real-time insights which goes beyond the limitations of traditional web analytics with features such as product analytics, session replay, error analysis, funnel, and path analysis.
With Replaybird, you can capture a complete picture of user behavior, understand their pain points, and improve the overall end-user experience. Session replay feature allows you to watch user sessions in real-time, so you can understand their actions, identify issues and quickly take corrective actions. Error analysis feature helps you identify and resolve javascript errors as they occur, minimizing the negative impact on user experience.
With product analytics feature, you can get deeper insights into how users are interacting with your product and identify opportunities to improve. Drive understanding, action, and trust, leading to improved customer experiences and driving business revenue growth.
Try ReplayBird 14-days free trial
 Velantina
 Velantina
 Velantina