
To optimize digital products and experiences, it is important to understand the difference between product analytics and digital experience analytics, as they each have distinct areas of concentration and approaches.
Product analytics centers on evaluating product performance and pinpointing areas for enhancement, whereas digital experience analytics aims to comprehend user experience and identify areas of difficulty.
Understanding these differences can help you choose the right metrics to measure and the right tools to use.
For instance, product analytics may necessitate measuring metrics like conversion rate or retention rate, whereas digital experience analytics may necessitate measuring metrics such as bounce rate or time on page.
Furthermore, distinction between these two types of analytics can facilitate integrating them into a comprehensive approach.
Using both product analytics and digital experience analytics enables gaining a more holistic perspective of users' experiences and identifying improvement opportunities that may not be evident when relying on a single type of analytics.
Comprehending the contrast between product analytics and digital experience analytics can equip you to make well-informed decisions regarding how to optimize digital products and experiences.
This results in boosted user experiences, increased revenue, and improved overall success.
- What is Product Analytics?
- What is Digital Experience Analytics?
- Differences Between Product Analytics and Digital Experience Analytics
- Integrating Product and Digital Experience Analytics for Comprehensive Insights
- Combined Insights from Product and Digital Experience Analytics
What is Product Analytics?
Product analytics is the practice of gathering and evaluating data pertaining to the functionality and utilization of a digital product, such as a mobile application or website.
The primary objective of product analytics is to obtain valuable insights into how users engage with the product, with the intention of enhancing and refining the user experience.
The process of product analytics comprises monitoring a broad array of metrics, including user engagement, conversion rates, retention rates, and churn rates.
By inspecting this data, product teams can identify areas where users are encountering problems or where the product is not meeting their requirements.
These data-driven discoveries can then be employed to make informed decisions, leading to the improvement of the user experience and driving favorable business outcomes.
Product analytics can be used in a variety of ways, including:
- Product Development: Product analytics can help product teams identify areas of the product that are not meeting user needs or expectations. By analyzing data related to user behavior and feedback, product teams can prioritize development efforts to address these areas and improve the user experience.
- User Onboarding: Product analytics optimize the user onboarding process, which is the process of introducing new users to the product and helping them get started. By tracking user behavior and engagement during the onboarding process, product teams can identify areas where users are experiencing issues or drop off and make changes to the onboarding process to improve user retention.
- Customer Insights: Product analytics can provide valuable insights into customer behavior and preferences. By analyzing data related to user demographics, usage patterns, and engagement, product teams can gain a deeper understanding of their target audience and tailor the product to better meet their needs.
- Product Success: Product analytics strategies can be used to track key performance metrics, such as conversion rates, retention rates, and revenue. By monitoring these metrics, product teams can determine the success of the product and make data-driven decisions to optimize its performance and increase revenue.
Examples of Product Analytics
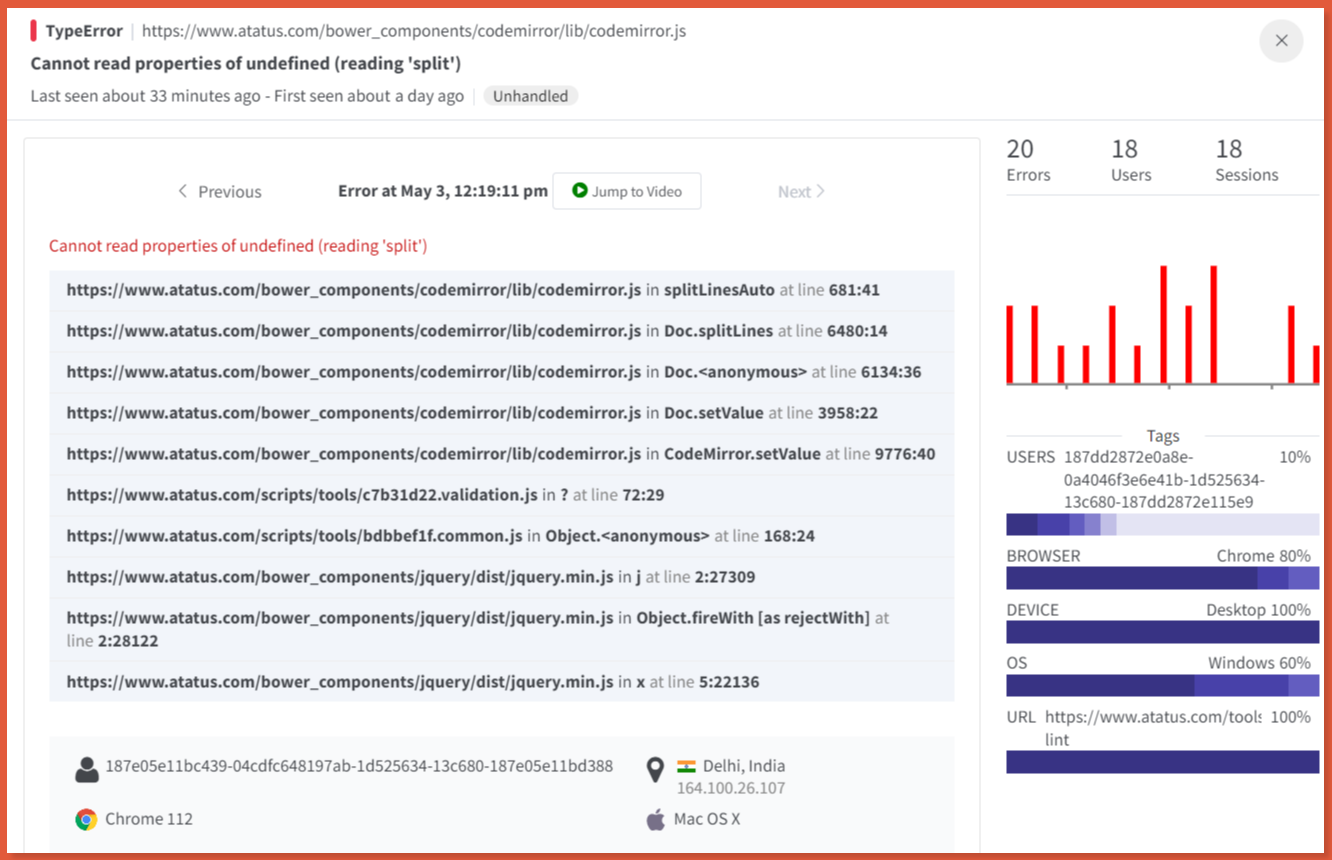
1. Error Analysis: Error analysis analyzes the frequency and types of errors that occur within the product, such as 404 errors or payment processing errors. By tracking error rates, product teams can identify technical issues and prioritize fixes to improve the user experience.
2. Activation Rate: It measures the percentage of users who complete the onboarding process and begin using the product. A high activation rate indicates that users are finding the onboarding process easy and engaging and are more likely to become long-term users.
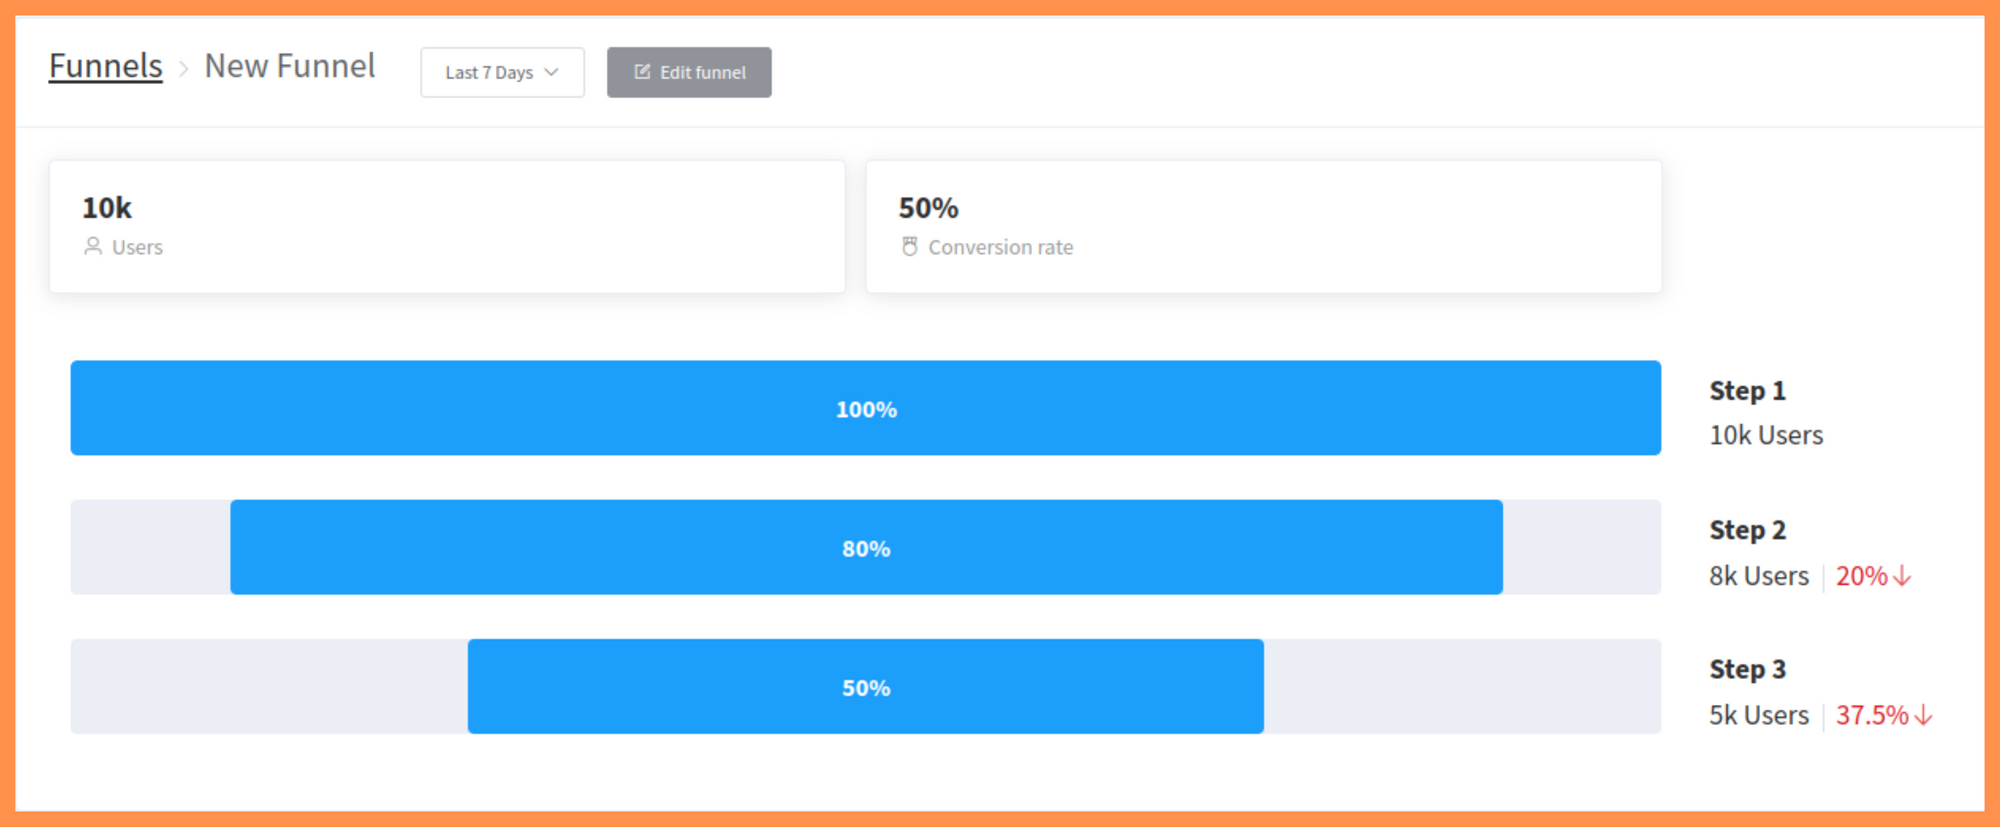
3. Funnel Analysis and Conversion Rate: It tracks the steps users take to complete a specific action, such as making a purchase. By analyzing these metrics, product teams can identify areas where users are dropping off and make changes to improve the user experience and drive conversions.
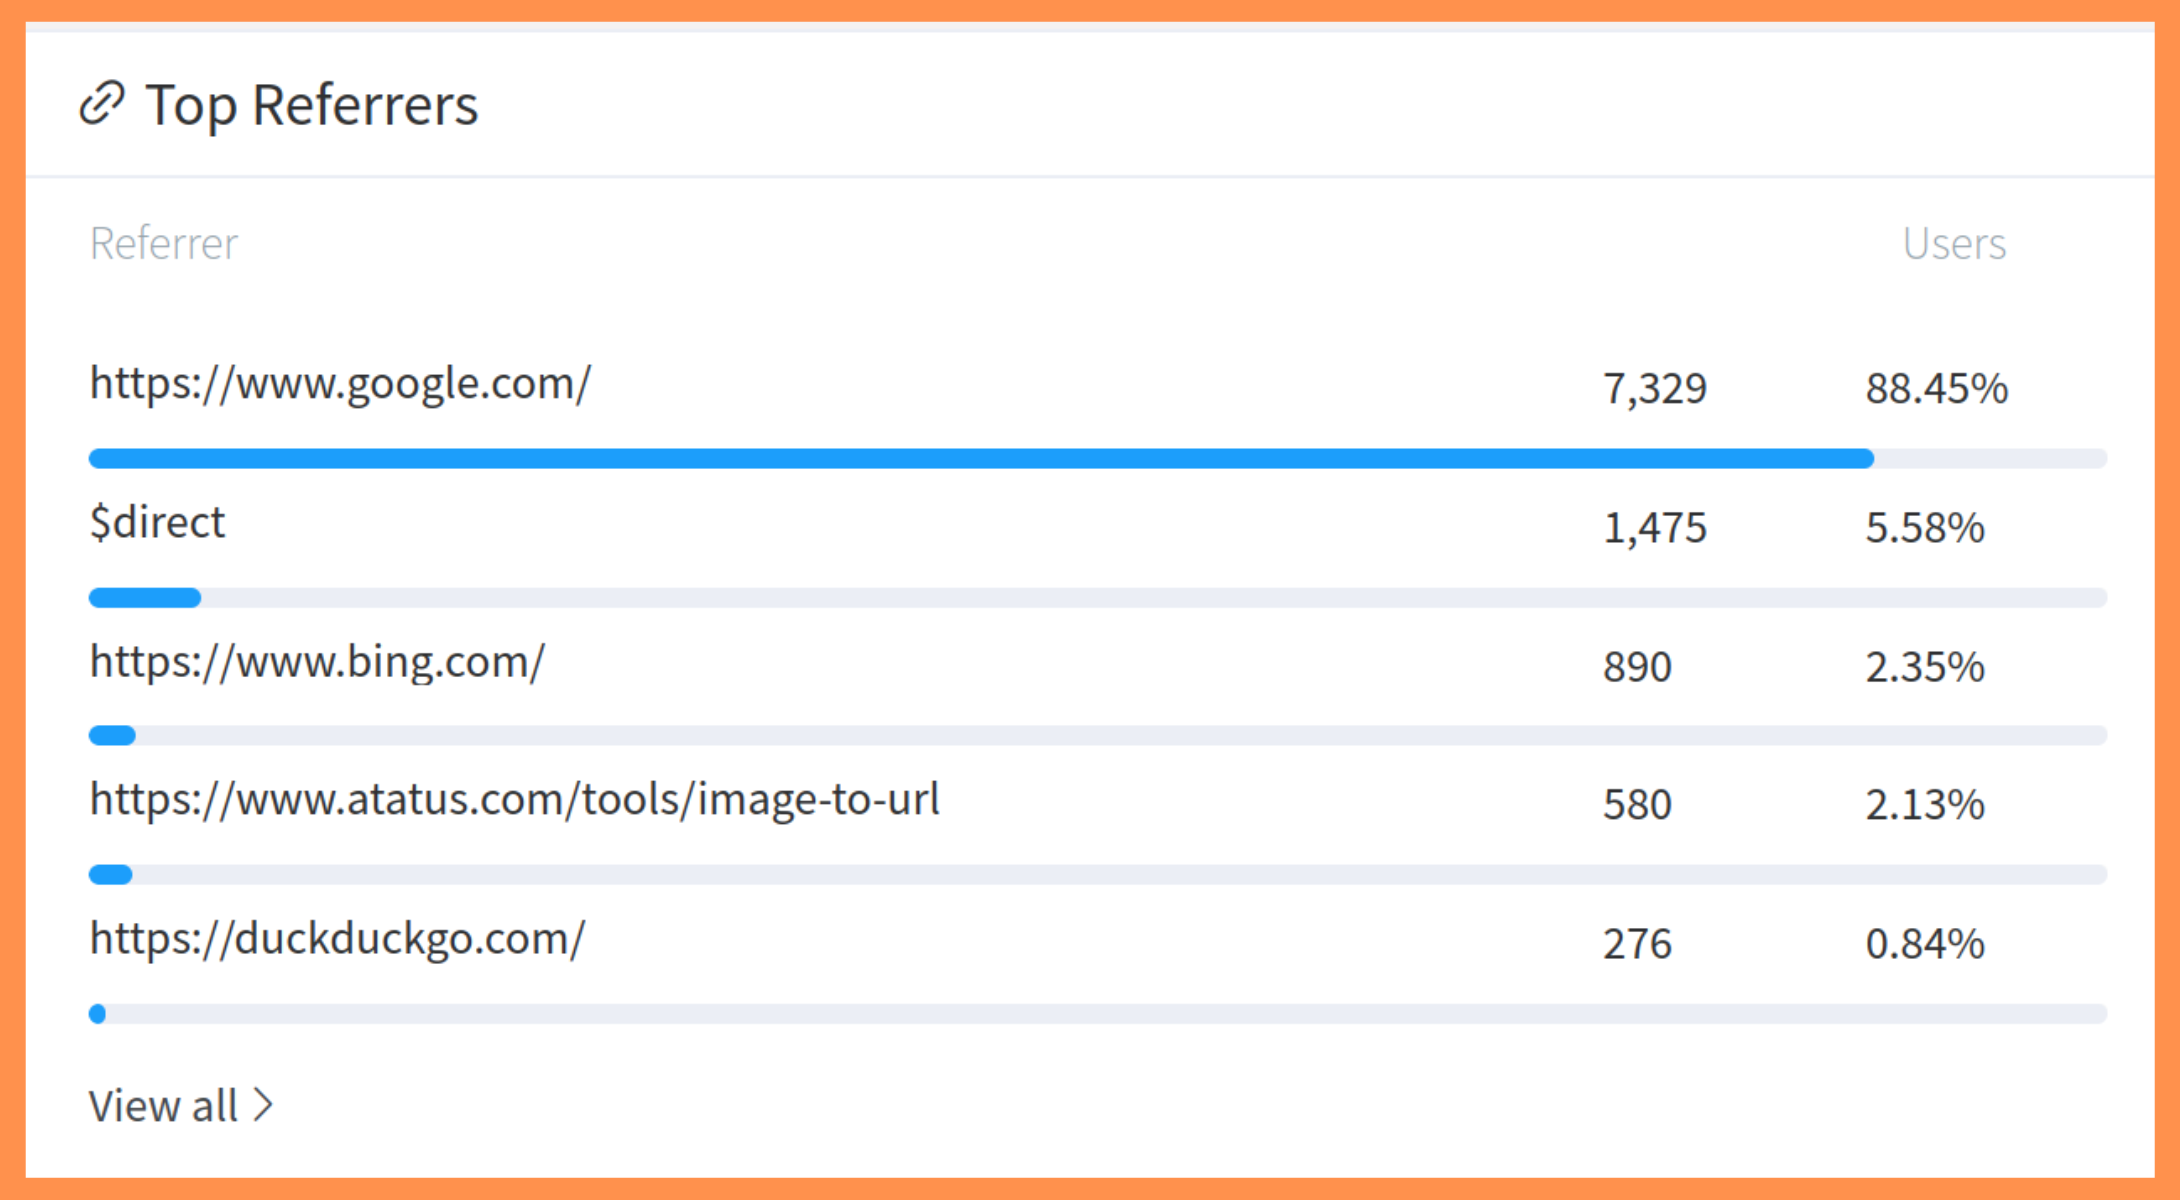
4. Referral Metrics: Referral metrics, such as referral rate or referral conversion rate, track the number of users who are referring the product to others and the percentage of those referrals who are converting to new users. By analyzing these metrics, product teams can identify opportunities to encourage more referrals and increase user acquisition.
5. Retention Rate: It measures the percentage of users who continue to use a product over time. High retention rates are a sign of a strong product that meets users' needs and keeps them engaged.
6. NPS (Net Promoter Score): It measures customer loyalty and satisfaction by asking users to rate the product on a scale of 0-10 and provide feedback. A high NPS (Net Promoter Score) indicates that users are satisfied with the product and more likely to recommend it to others.
7. Churn Rate: It refers to the percentage of users who stop using a product over a given period. A high churn rate can be an indicator that users are not finding the product valuable or that there are issues with the user experience.
What is Digital Experience Analytics?
The analysis of data related to user experience on digital channels, including websites, mobile apps, and social media platforms, is known as digital experience analytics.
The purpose of digital experience analytics is to acquire insight into how users interact with digital touchpoints and use the data to improve and optimize the user experience.
Digital experience analytics involves tracking various metrics, including user engagement, click-through rates, page load times, and conversion rates.
By scrutinizing this data, digital teams can identify where users experience issues or where the digital experience fails to meet user needs.
They can then make data-driven decisions to enhance and optimize the user experience.
Digital experience analytics can be used in a variety of ways, including:
- Website Optimization: By analyzing website user behavior data, digital teams can identify areas of the website that are not meeting user needs or expectations and optimize the website to better meet user needs. For example, if a digital analytics tool reveals that users are leaving a website page quickly, the digital team can use this information to make changes to the page design or content to improve user engagement.
- Mobile App Optimization: Digital experience analytics can help mobile app developers optimize the user experience on their app. By analyzing data related to app usage and user engagement, app developers can identify areas where users are experiencing issues or where the app is not meeting user needs and make data-driven decisions to improve the user experience.
- Social Media Optimization: Digital experience analytics can help social media marketers optimize the user experience on social media platforms. By analyzing data related to user engagement and post-performance, social media marketers can identify which types of posts and content are resonating with their audience and make data-driven decisions to optimize their social media strategy.
- Customer Insights: Digital experience analytics can provide insights into customer behavior and preferences, allowing digital teams to tailor the digital experience to better meet the needs of their target audience. By analyzing data related to user demographics, usage patterns, and engagement, digital teams can gain a deeper understanding of their target audience and create a more personalized digital experience.
Examples of Digital experience analytics
1. Scroll Depth: It measures how far users scroll down a page on a website or mobile app. This metric can be used to evaluate user engagement and to identify areas where content may need to be optimized.
2. Engagement Rate: User Engagement measures the level of user engagement with a particular piece of content, such as a social media post or blog article. This metric can be used to evaluate the effectiveness of content and to identify which types of content resonate with users.
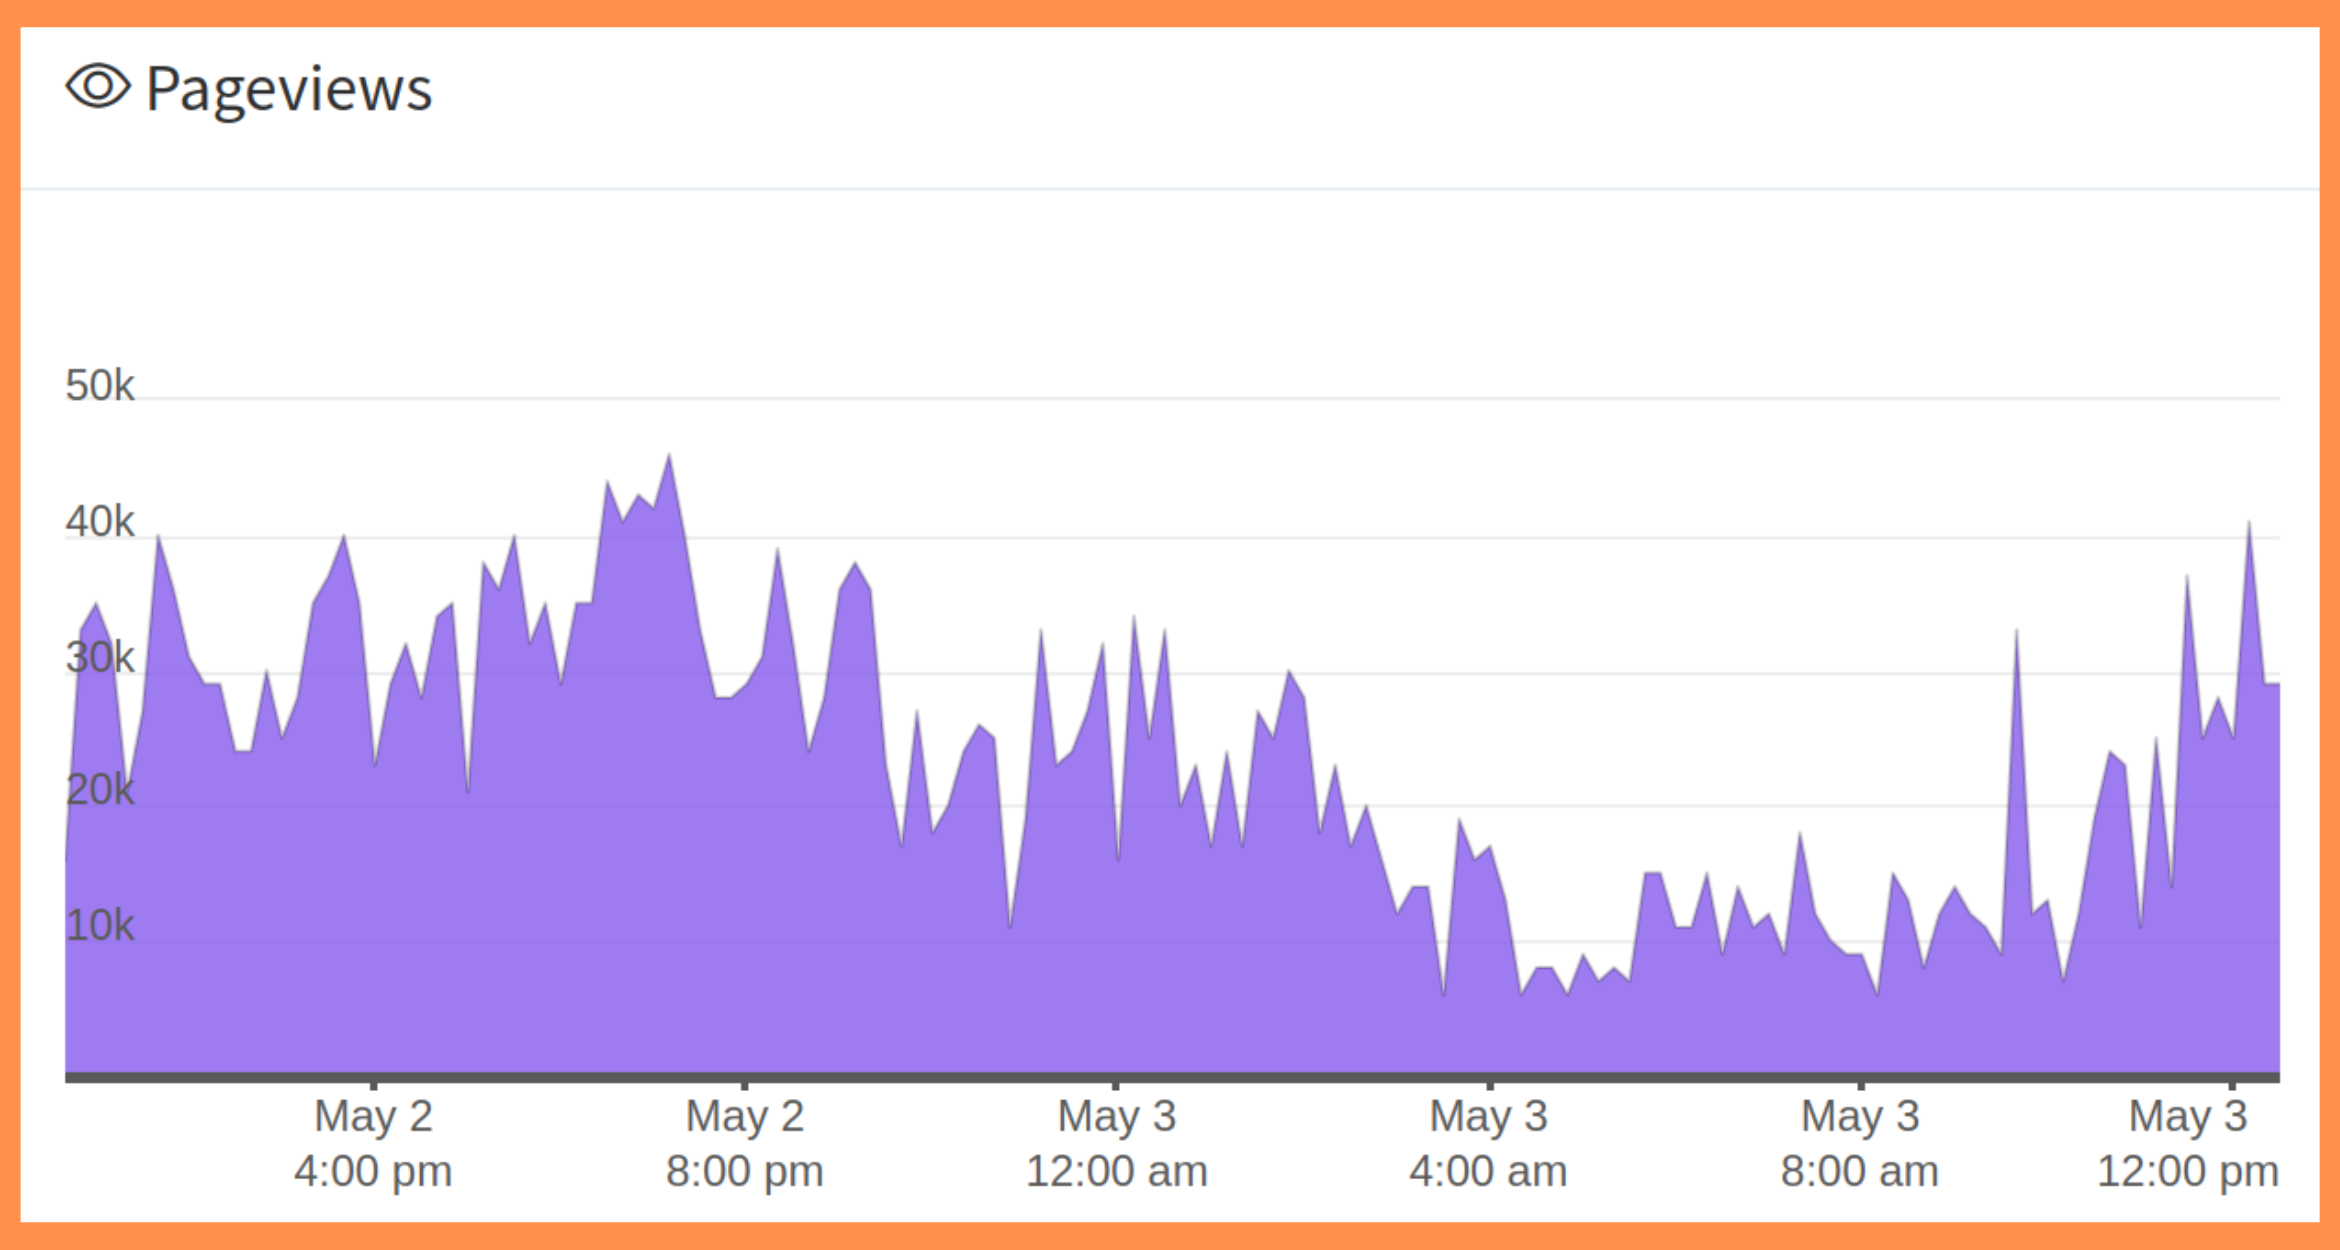
3. Pageviews: It measures the number of times a particular page on a website or mobile app is viewed by users. This metric can be used to evaluate the popularity of specific pages and to identify which pages are driving the most traffic.
4. Click-Through Rate (CTR): Click-Through Rate (CTR) measures the percentage of users who click on a link or call-to-action (CTA) within a digital channel such as a website, email, or social media platform. This metric can be used to evaluate the effectiveness of CTAs and to identify areas for optimization.
5. Bounce Rate: It measures the percentage of users who land on a page on a website and then leave without interacting with the page. A high bounce rate can indicate that the page is not meeting user needs or expectations.
6. Time on Page: It measures the amount of time that users spend on a particular page of a website or mobile app. This metric can be used to evaluate user engagement and to identify which pages or content are most effective in keeping users engaged.
7. Exit Rate: It measures the percentage of users who leave a website or mobile app after viewing a specific page. This metric can be used to identify which pages are causing users to leave and to make improvements to the user experience.
Differences Between Product Analytics and Digital Experience Analytics
| Product Analytics | Digital Experience Analytics | |
|---|---|---|
| Focus | Product analytics focuses on understanding how users interact with a specific product or service, such as a website or mobile app. It aims to identify which features are most popular and effective, as well as areas that need improvement. | Digital experience analytics, on the other hand, is a broader field that focuses on understanding user behavior across all digital channels, including websites, mobile apps, social media, and email. |
| Metrics | Product analytics typically focuses on metrics such as conversion rate, retention rate, and churn rate, which provide insights into how users are interacting with a product and whether they are likely to continue using it. | Digital experience analytics, on the other hand, focuses on metrics such as bounce rate, time on page, and click-through rate, which provide insights into user engagement and behavior across a wide range of digital channels. |
| Methods | Product analytics typically involves collecting data through tools such as event tracking, A/B testing, and user surveys. This data is then analyzed to identify patterns and trends in user behavior. | Digital experience analytics, on the other hand, often involves the use of tools such as web analytics platforms, social media monitoring tools, and email marketing platforms to collect and analyze data from multiple channels. |
| Goals | The goal of product analytics is to identify areas where a product can be improved and optimized to better meet user needs and drive business growth. | The goal of digital experience analytics is to gain a holistic understanding of user behavior across all digital touchpoints and identify opportunities to improve the overall user experience. |
| Granularity | Product analytics often involves collecting detailed, granular data on user behavior, such as individual clicks and actions within a product. | Digital experience analytics, on the other hand, often focuses on higher-level metrics that provide a broader view of user engagement and behavior, such as website traffic and social media engagement. |
| User feedback | Product analytics often involves collecting direct feedback from users through surveys and other forms of feedback. | Digital experience analytics may also incorporate user feedback, but it often relies more heavily on indirect data, such as website and social media analytics. |
| Scope | Product analytics typically focuses on a specific product or service, while digital experience analytics looks at the broader digital ecosystem. Product analytics is concerned with how users interact with a product. | Digital experience analytics considers how users engage with a brand across multiple channels. |
Integrating Product and Digital Experience Analytics for Comprehensive Insights
Integrating product analytics and digital experience analytics into a comprehensive approach involves several steps.
First, define the KPIs that will be used to measure the effectiveness of both product analytics and digital experience analytics, aligned with business goals and objectives and measurable and actionable.
Second, collecting data from both product analytics and digital experience analytics tools and analyzing it to gain insights into user behavior, product performance, and overall user experience.
Data visualization and reporting tools can be used to identify patterns and trends in the data.
Third, using the insights gained from product analytics and digital experience analytics to identify areas of the product and user experience that need improvement.
This could include issues with specific features, as well as broader issues with the overall user journey.
Fourth, developing strategies to address the identified issues and improve the user experience.
This may involve changes to the product design or functionality, as well as changes to the digital experience, such as website design or marketing campaigns.
Fifth, monitoring the results of the improvement strategies using the defined KPIs and evaluating their impact on the user experience and business performance.
This information can be used to refine the strategies and continue making data-driven improvements.
Finally, sharing insights and collaborating across different teams within the organization, such as product development, marketing, and customer experience, ensures that everyone has a shared understanding of the user experience and the strategies being implemented to improve it.
By integrating product analytics and digital experience analytics into a comprehensive approach, businesses can gain a complete understanding of the user experience, identify opportunities for improvement, and make data-driven decisions to optimize the user experience and drive business growth.
The key is to define clear KPIs, collect and analyze data from both types of analytics tools, and develop and implement strategies to improve the user experience based on the insights gained from the data.
Combined Insights from Product and Digital Experience Analytics
#1 Increasing customer satisfaction
By leveraging insights from both types of analytics, businesses can better understand their customers and their needs, which can lead to increased customer satisfaction. If product analytics reveals that customers are frequently contacting customer support about a particular issue, businesses can use this information to address the issue and reduce the number of support requests.
#2 Personalizing the user experience
Digital experience analytics can provide insights into user behavior and preferences, allowing businesses to personalize the user experience based on individual user needs and preferences. This can include personalized recommendations, tailored marketing campaigns, and customized content.
#3 Improving user engagement
Product analytics can provide insights into user behavior patterns, preferences, and usage trends, which can help businesses make informed decisions about how to improve user engagement. Businesses can use data to identify which features are most popular among users and which ones are underutilized, allowing them to prioritize development efforts accordingly.
#4 Improving product design
By analyzing user behavior data and feedback from product analytics, product teams can identify areas of the product that are not meeting user needs or expectations. They can then use this information to make changes to the design or functionality of the product to improve the user experience and increase engagement.
#5 Identifying areas for improvement
By analyzing data from both product analytics and digital experience analytics, businesses can identify areas where users are struggling or experiencing friction in the user journey. This can help businesses make targeted improvements to the product or user experience, such as by simplifying the onboarding process or improving the search functionality.
#6 Increasing revenue
By optimizing digital products and experiences using insights from both types of analytics, businesses can ultimately drive increased revenue. By improving user engagement and satisfaction, businesses can increase customer lifetime value, while optimizing marketing campaigns can lead to increased conversions and sales.
#7 Enhancing user experience
Digital experience analytics can provide insights into how users interact with a website or app, including how they navigate between pages, how long they stay on a particular page, and which elements they interact with the most. This information can be used to optimize the user experience, such as by improving page load times, reducing clutter on pages, or streamlining the checkout process.
#8 Reducing churn
By analyzing data from both product analytics and digital experience analytics, businesses can identify users who are at risk of churning and take proactive steps to prevent them from leaving. This may involve reaching out to users with targeted messages or offers or making changes to the product or user experience to address their concerns.
#9 Optimizing marketing campaigns
By analyzing data from both product analytics and digital experience analytics, businesses can gain insights into the effectiveness of marketing campaigns and make data-driven decisions to optimize them. They can use data to identify which marketing channels are driving the most traffic to the website, which campaigns are resulting in the highest conversion rates, and which messaging resonates best with different user segments.
Conclusion:
In conclusion, product analytics and digital experience analytics, when used in conjunction, offer businesses a comprehensive understanding of their customers' behavior and needs.
By analyzing user behavior at a granular level, product analytics can provide insights into how customers engage with specific products or features on a website.
This, in turn, allows businesses to optimize their offerings to better serve their customers' needs and increase customer engagement.
On the other hand, digital experience analytics provides a broader view of the user journey, from the moment a customer enters a website to the point of conversion or abandonment.
By analyzing the entire user experience, businesses can pinpoint pain points and identify areas for improvement in their website's design, navigation, and checkout process.
Addressing these issues can reduce cart abandonment rates, improve the overall digital experience, and drive more conversions and revenue for the business.
ReplayBird - Driving Revenue and Growth through Actionable Product Analytics and Digital Experience Analytics
ReplayBird is a digital experience analytics platform that offers a comprehensive real-time insights which goes beyond the limitations of traditional web analytics with features such as product analytics, session replay, error analysis, funnel, and path analysis.
With Replaybird, you can capture a complete picture of user behavior, understand their pain points, and improve the overall end-user experience. Session replay feature allows you to watch user sessions in real-time, so you can understand their actions, identify issues and quickly take corrective actions. Error analysis feature helps you identify and resolve javascript errors as they occur, minimizing the negative impact on user experience.
With product analytics feature, you can get deeper insights into how users are interacting with your product and identify opportunities to improve. Drive understanding, action, and trust, leading to improved customer experiences and driving business revenue growth.
Try ReplayBird 14-days free trial
Further Readings:
 Uma
Uma Afra
Afra Afra
Afra