
When you make a kickass product with a 360 visibility dashboard and all-round features, you'll also need to answer the following questions:
- Which journeys do my most active users take?
- Which user friction and frontend errors have the greatest impact on my product?
- How can I pinpoint exactly what customers are confused about and where they are having difficulty?
- How can I increase the number of people who complete each lead form and checkout step?
- Why are my website visitors abandoning and bouncing from my website me?
And to answer these pressing questions, you'll need to calculate the product metrics and the right ones at that.
In this guide, you'll see which metrics are the right ones and which you need to avoid.
Table of contents
- What are product metrics?
- What are product metrics used for?
- Why are product metrics important?
- Common product metrics
- Which product metrics to avoid?
- How to pick the right product metrics?
What are product metrics?
Product metrics is data on what kind interactions customers have with your product or website. It also shows how these interactions impact your digital presence and business.
Such metrics are useful for marketing, analytics and customer success teams who use it to look into technical areas on how the products being used and which areas have room for improvements and new updates.
Product metrics are basically used to gain proper insights on how successful your product or website is proving to be.
What are product metrics used for?
Product metrics are also used to provide and track customer behavior, this is also done using product analytics.
Product metrics usage differs over various companies and the goals they have set for themselves. Hence, they are used depending on the company's goal.
Some uses of product metrics are:
- To understand customer behaviour
- To identify customer struggles
- To measure the impact of features
- To predict future revenue
- To build a product strategy
- To test a product hypothesis
- To bring changes in the product
- To segment a product market
Some product metrics tools:
- ReplayBird - Visit ReplayBird
- Mixpanel - Visit Mixpanel
- Pendo - Visit Pendo
- Heap - Visit Heap
- ContentSquare - Visit ContentSquare
- LogRocket - Visit LogRocket
Why are product metrics important?
With it product metrics there wouldn't be any concrete and reliable source to track customer behavior or even understand the element of how your digital products are having an impact.
Product metrics provides data on how customers interact with your product. It is the best way to obtain objective, accurate and immediate data. Whereas business metrics and/or customer interviews would only give you the overall success and qualitative data.
Different product metrics provide under different context. While some may give an overall view of the product, others may be focused on the individual features of your product.
Common Product Metrics
- Monthly Recurring Revenue
- Customer Lifetime Value
- Customer Acquisation Cost
- Churn Rate
- Adoption Rate
- Daily Active User
- Conversion Rate
- Net Promoter Score
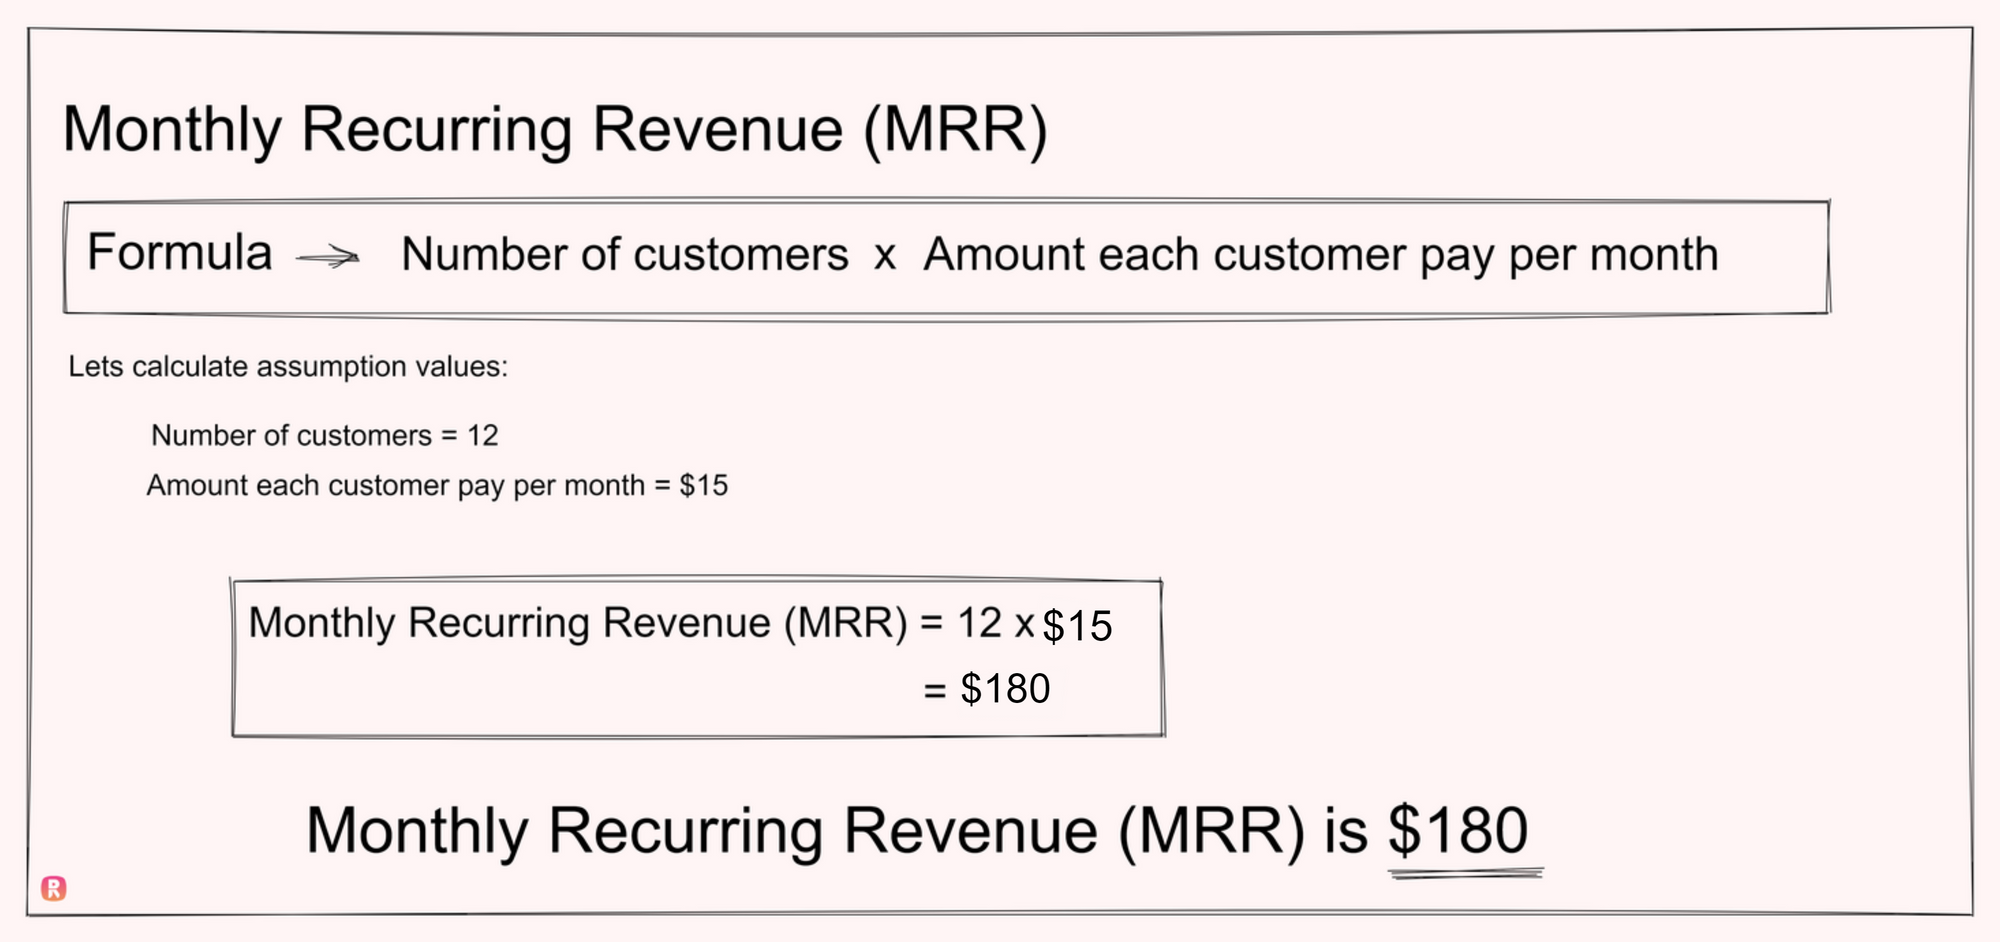
1. Monthly Recurring Revenue (MRR)
Monthly Recurring Revenue also known as MRR, calculates the amount of revenue brought in by your product per month in total. The MRR helps in predicting financial stability, cash flow, and upcoming revenue trends.
How to Calculate MRR:
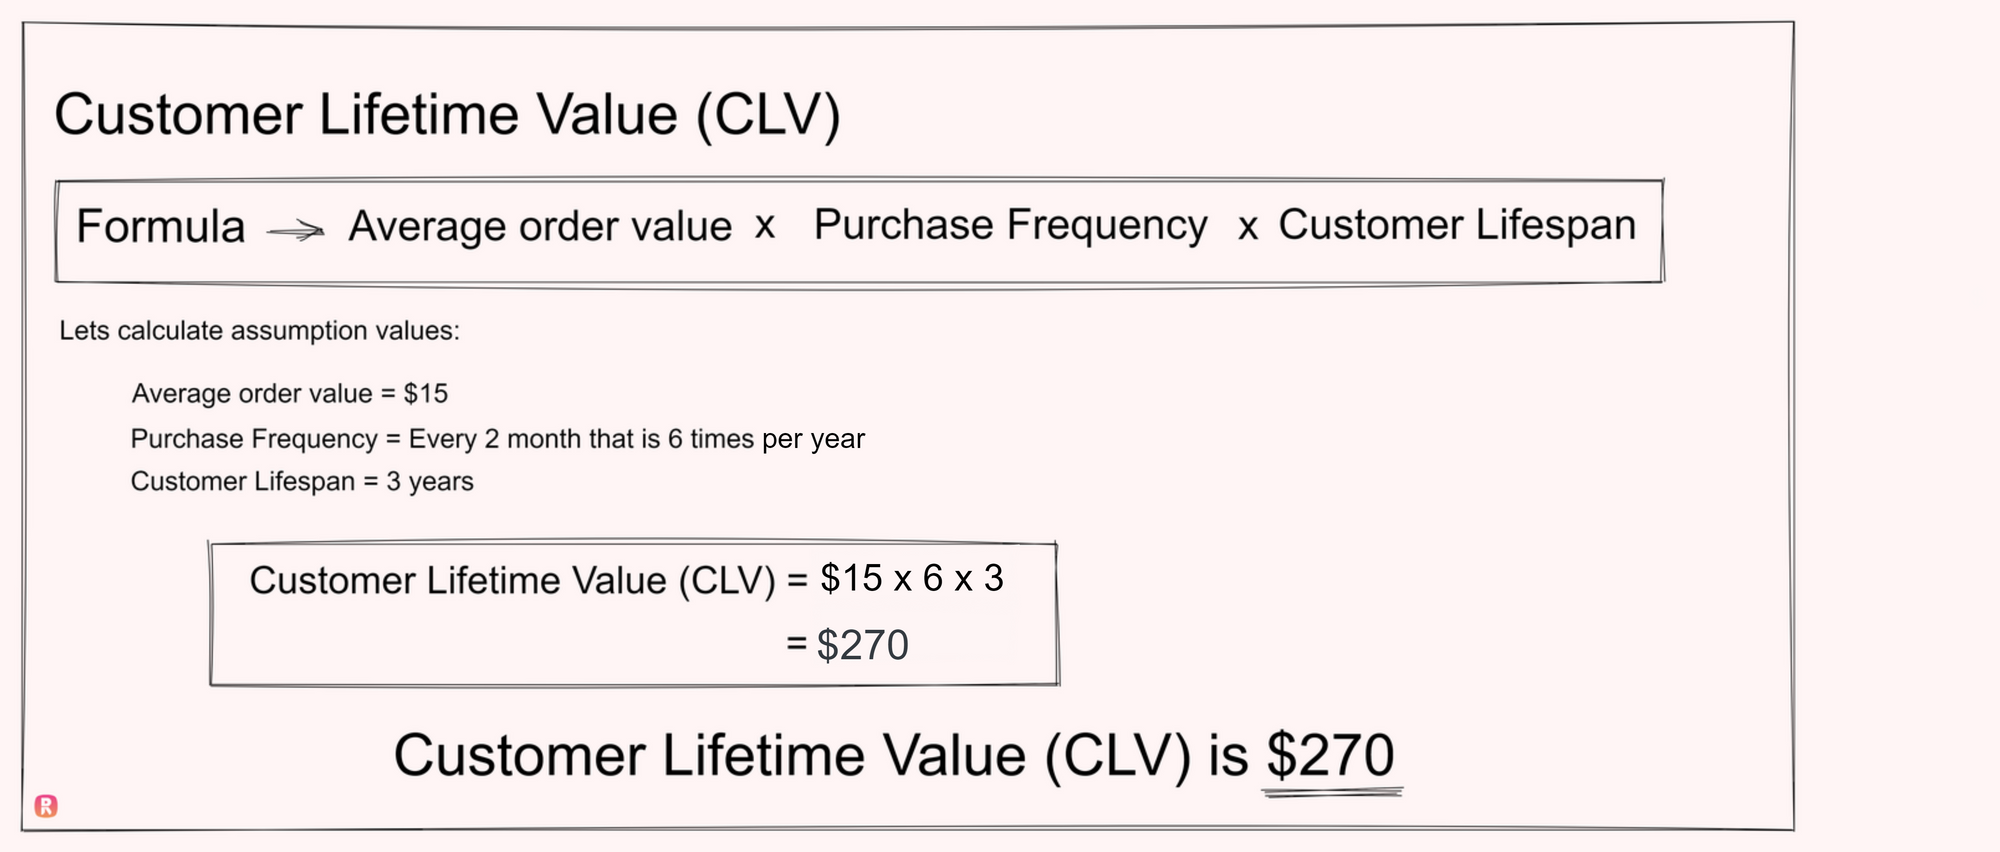
2. Customer Lifetime Value (CLV)
Customer Lifetime Value refers to the amount an average customer spends on your product through their relationship with your brand. The CLV gives you a guide as too much you should be spending on your customer acquisition front. It also tells you which customers you should be pursuing.
How to Calculate CLV:
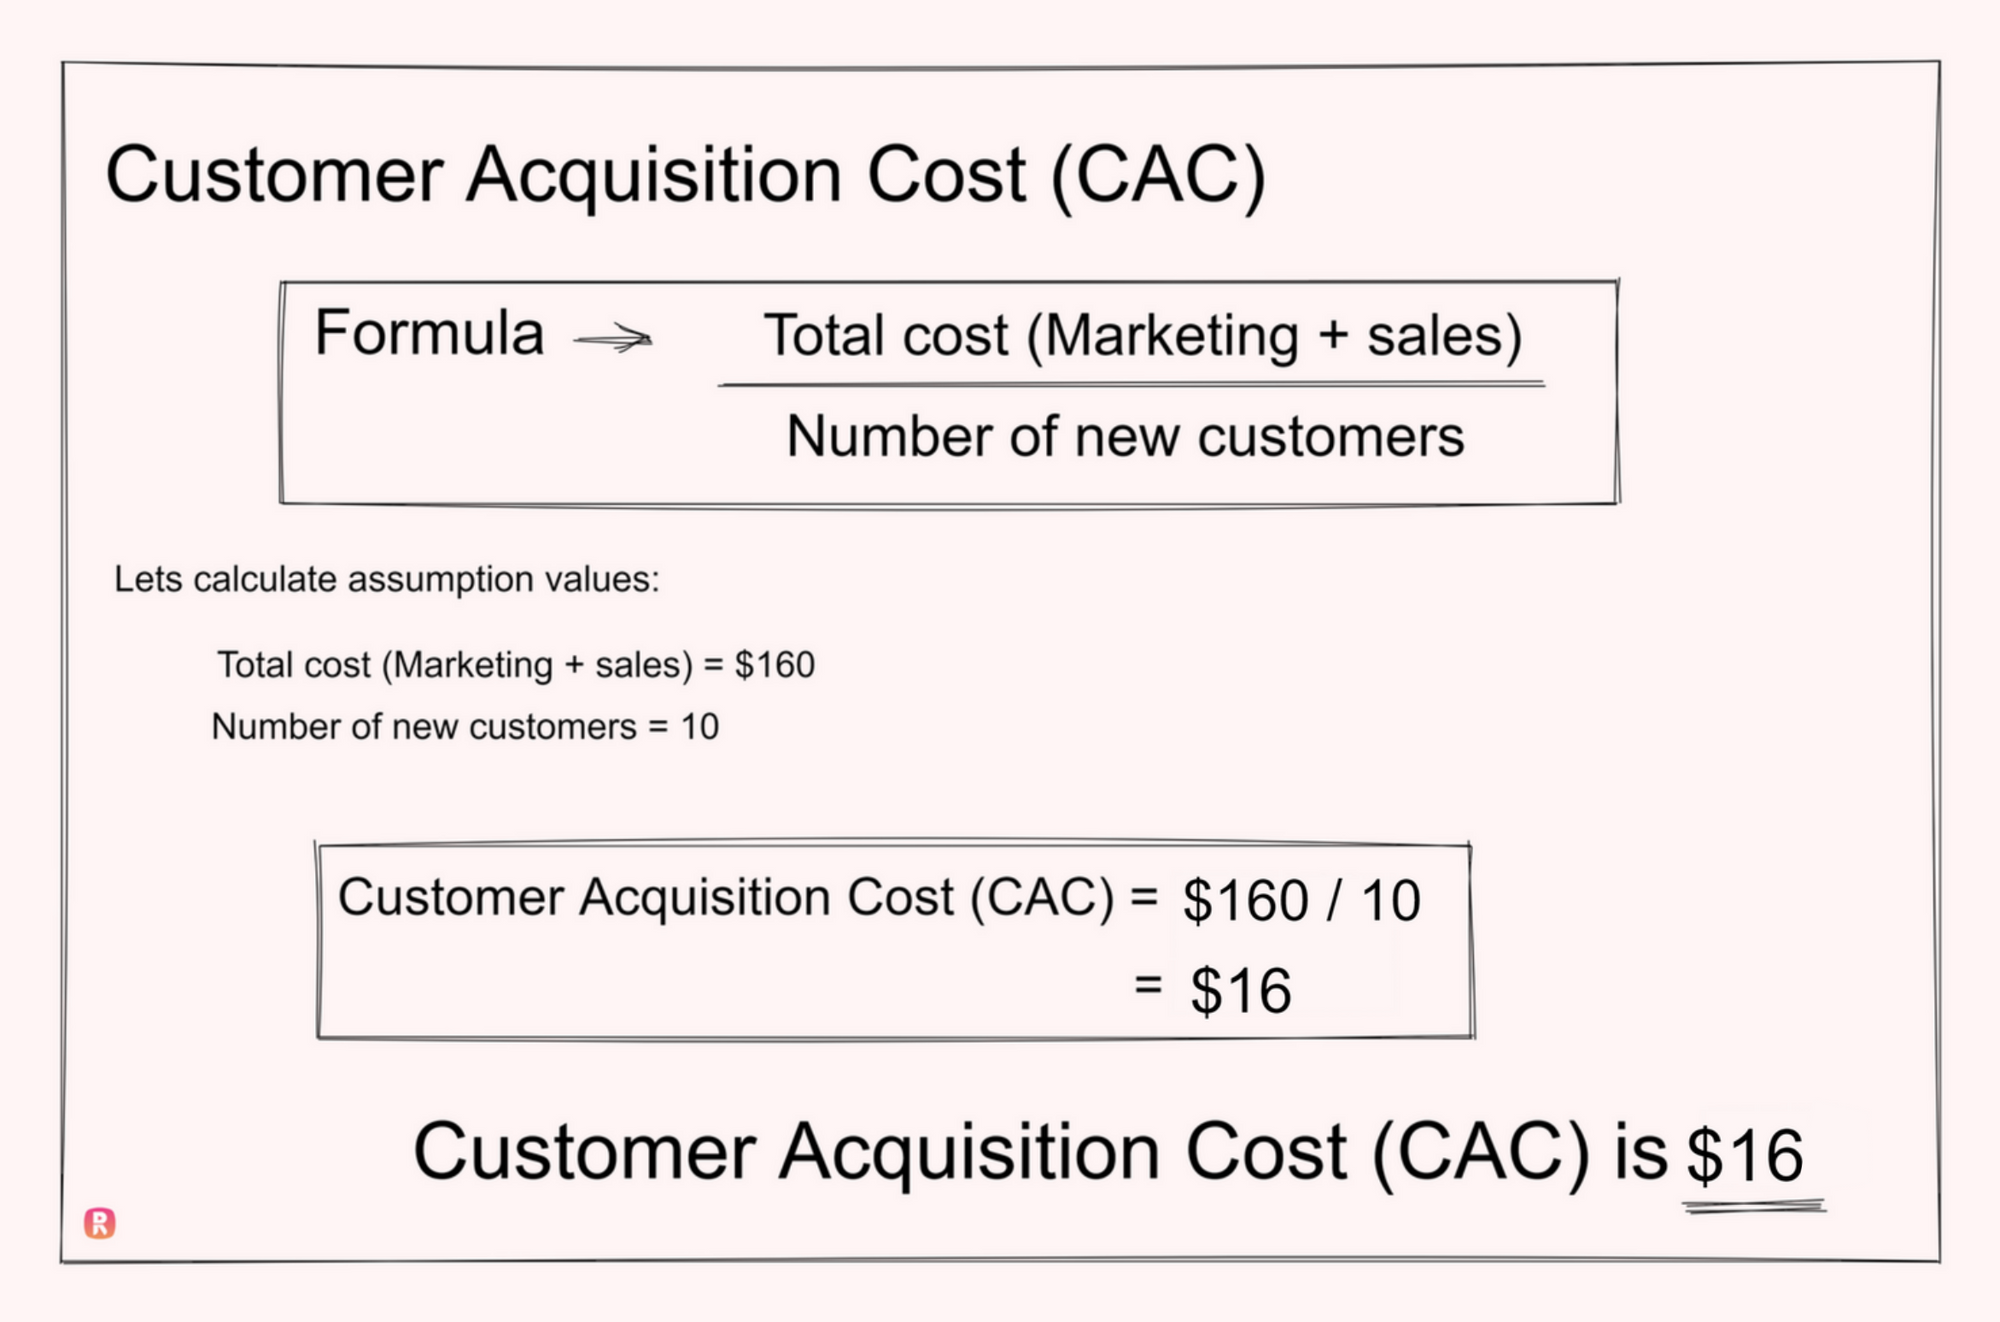
3. Customer Acquisition Cost (CAC)
Customer Acquisition Cost is the average amount spent on acquiring new customers by a brand. It is used to measure how efficient the company's marketing and sales team is. And it also identifies whether the amount spent on customer acquisition is worth the revenue that is being brought in.
How to Calculate CAC:
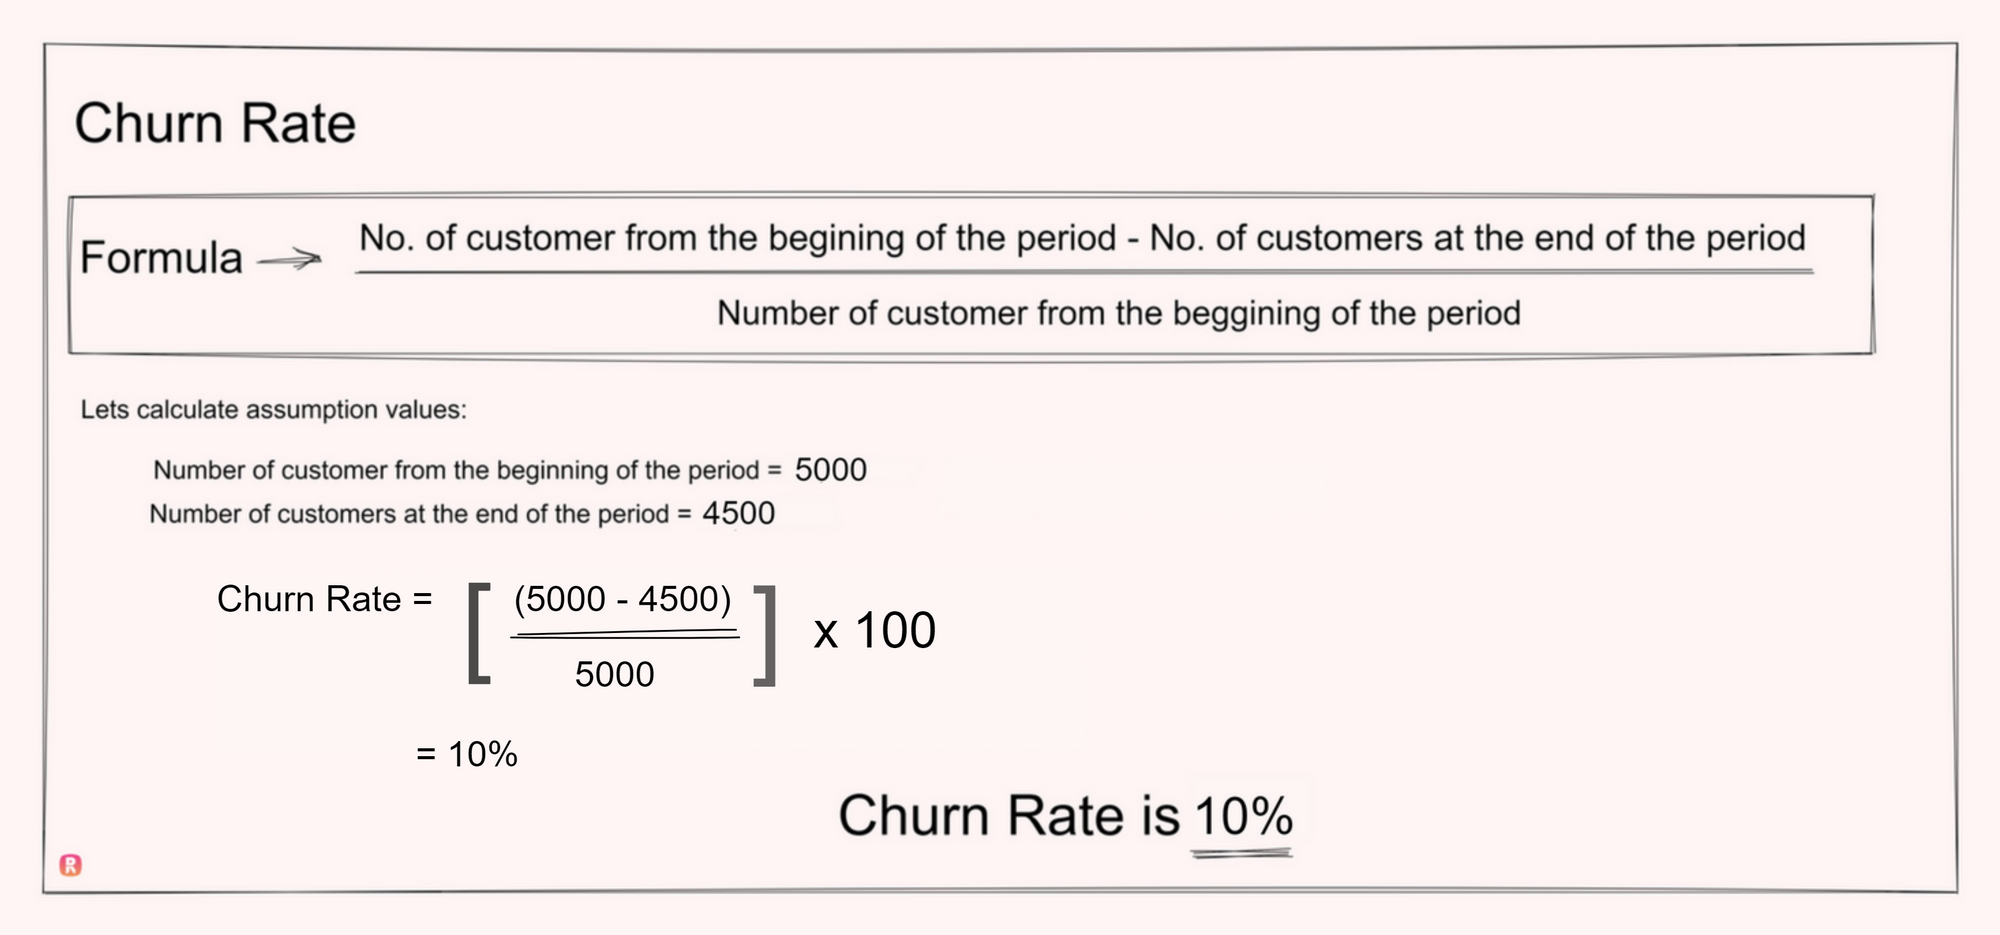
4. Churn Rate
Churn Rate measures the percentage of customers who stopped using your product over a period of time. It is said to keep track of the brand's ability to retain its customers and its seen as an alternate to customer satisfaction.
How to Calculate Churn Rate:
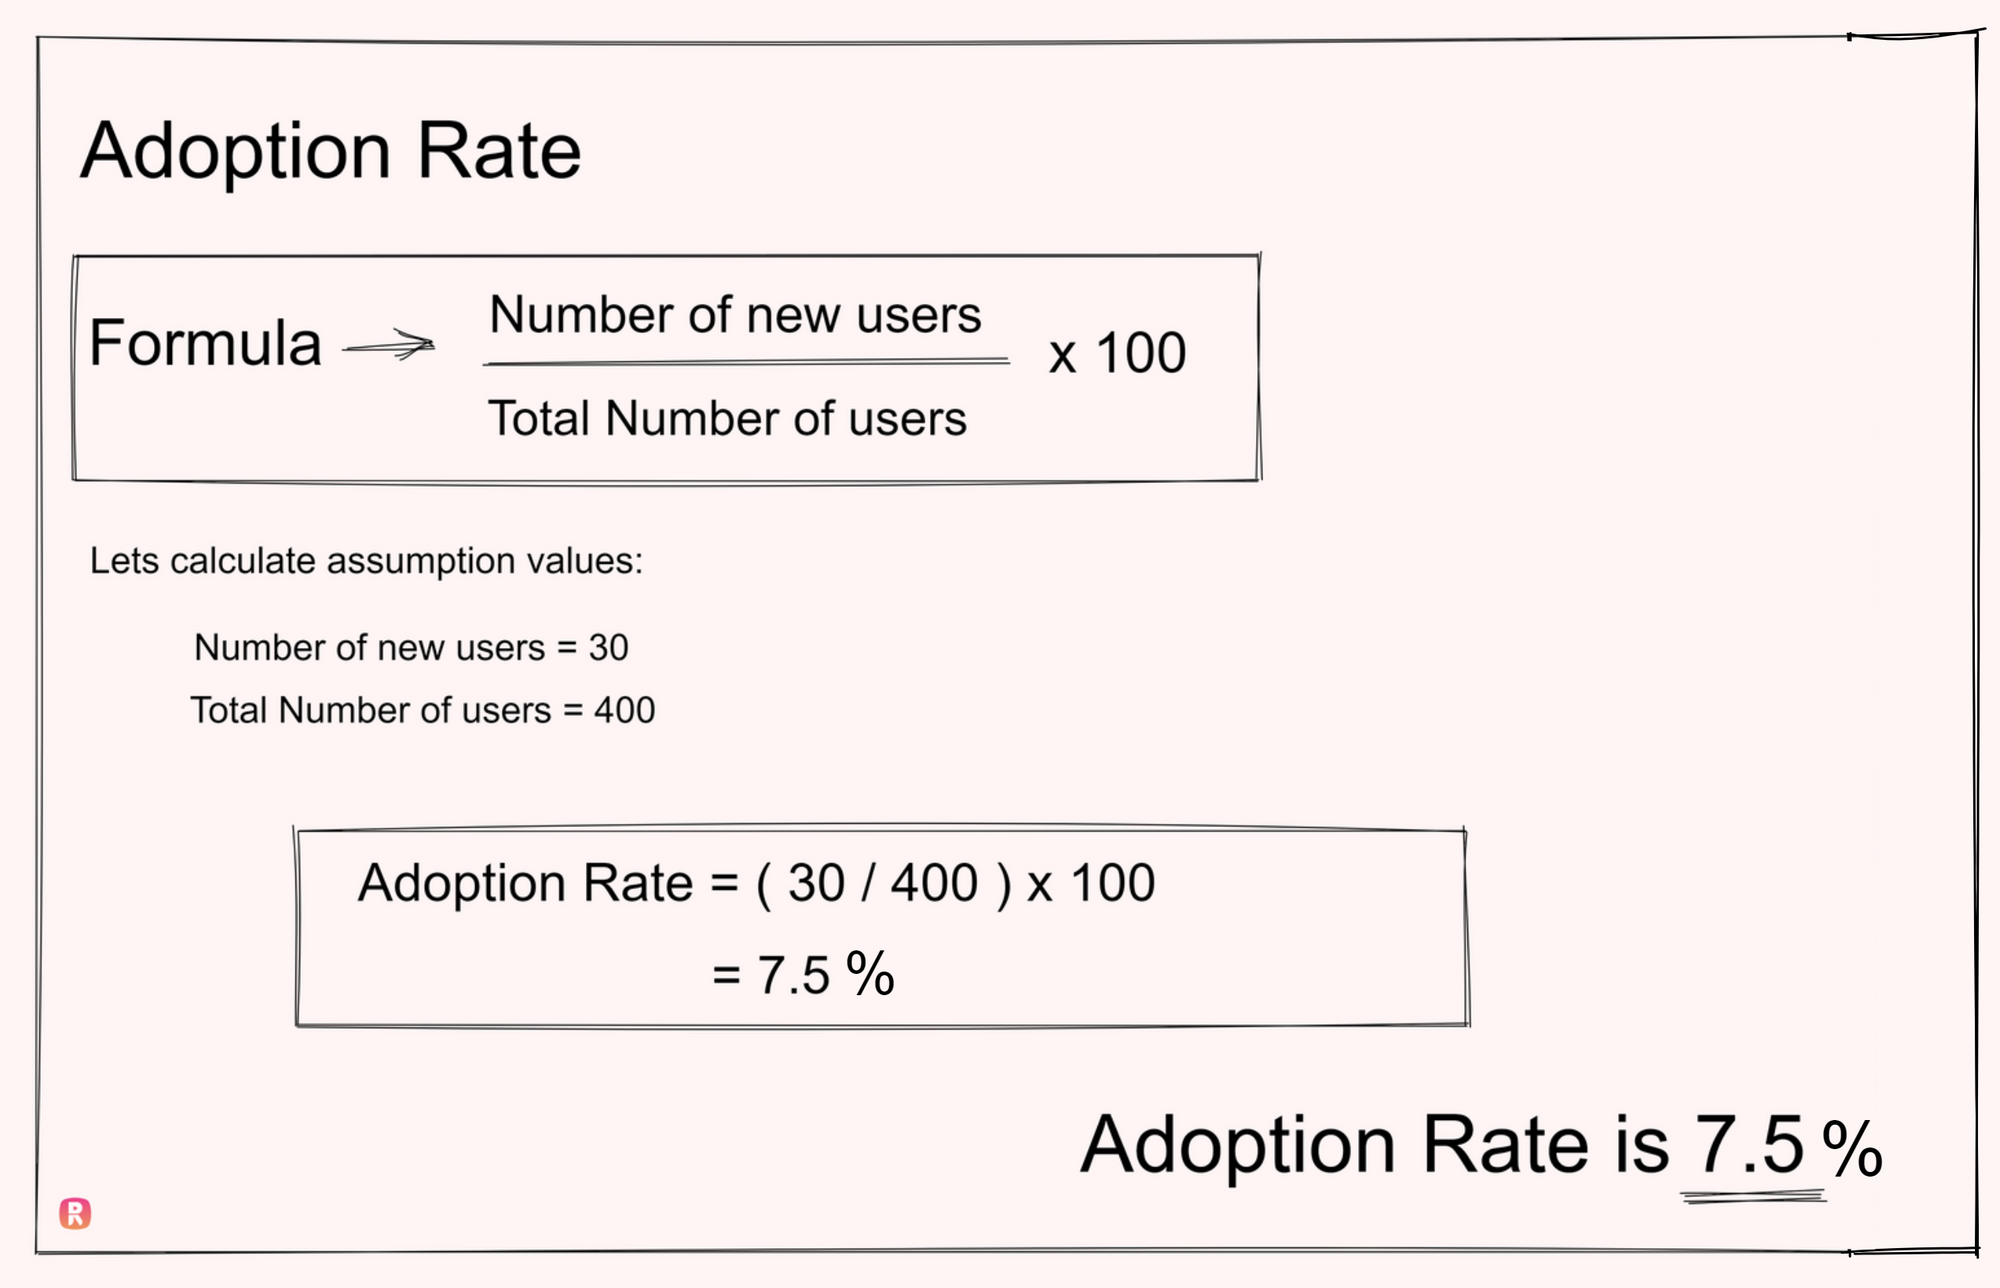
5. Adoption Rate
Adoption Rate is the number of customers who step forward and use your products earnestly. It is the percentage of customers who are past the exploration stage of the products and start using them. First, you need to identify which action or activities count as adoption.
How to Calculate Adoption Rate:
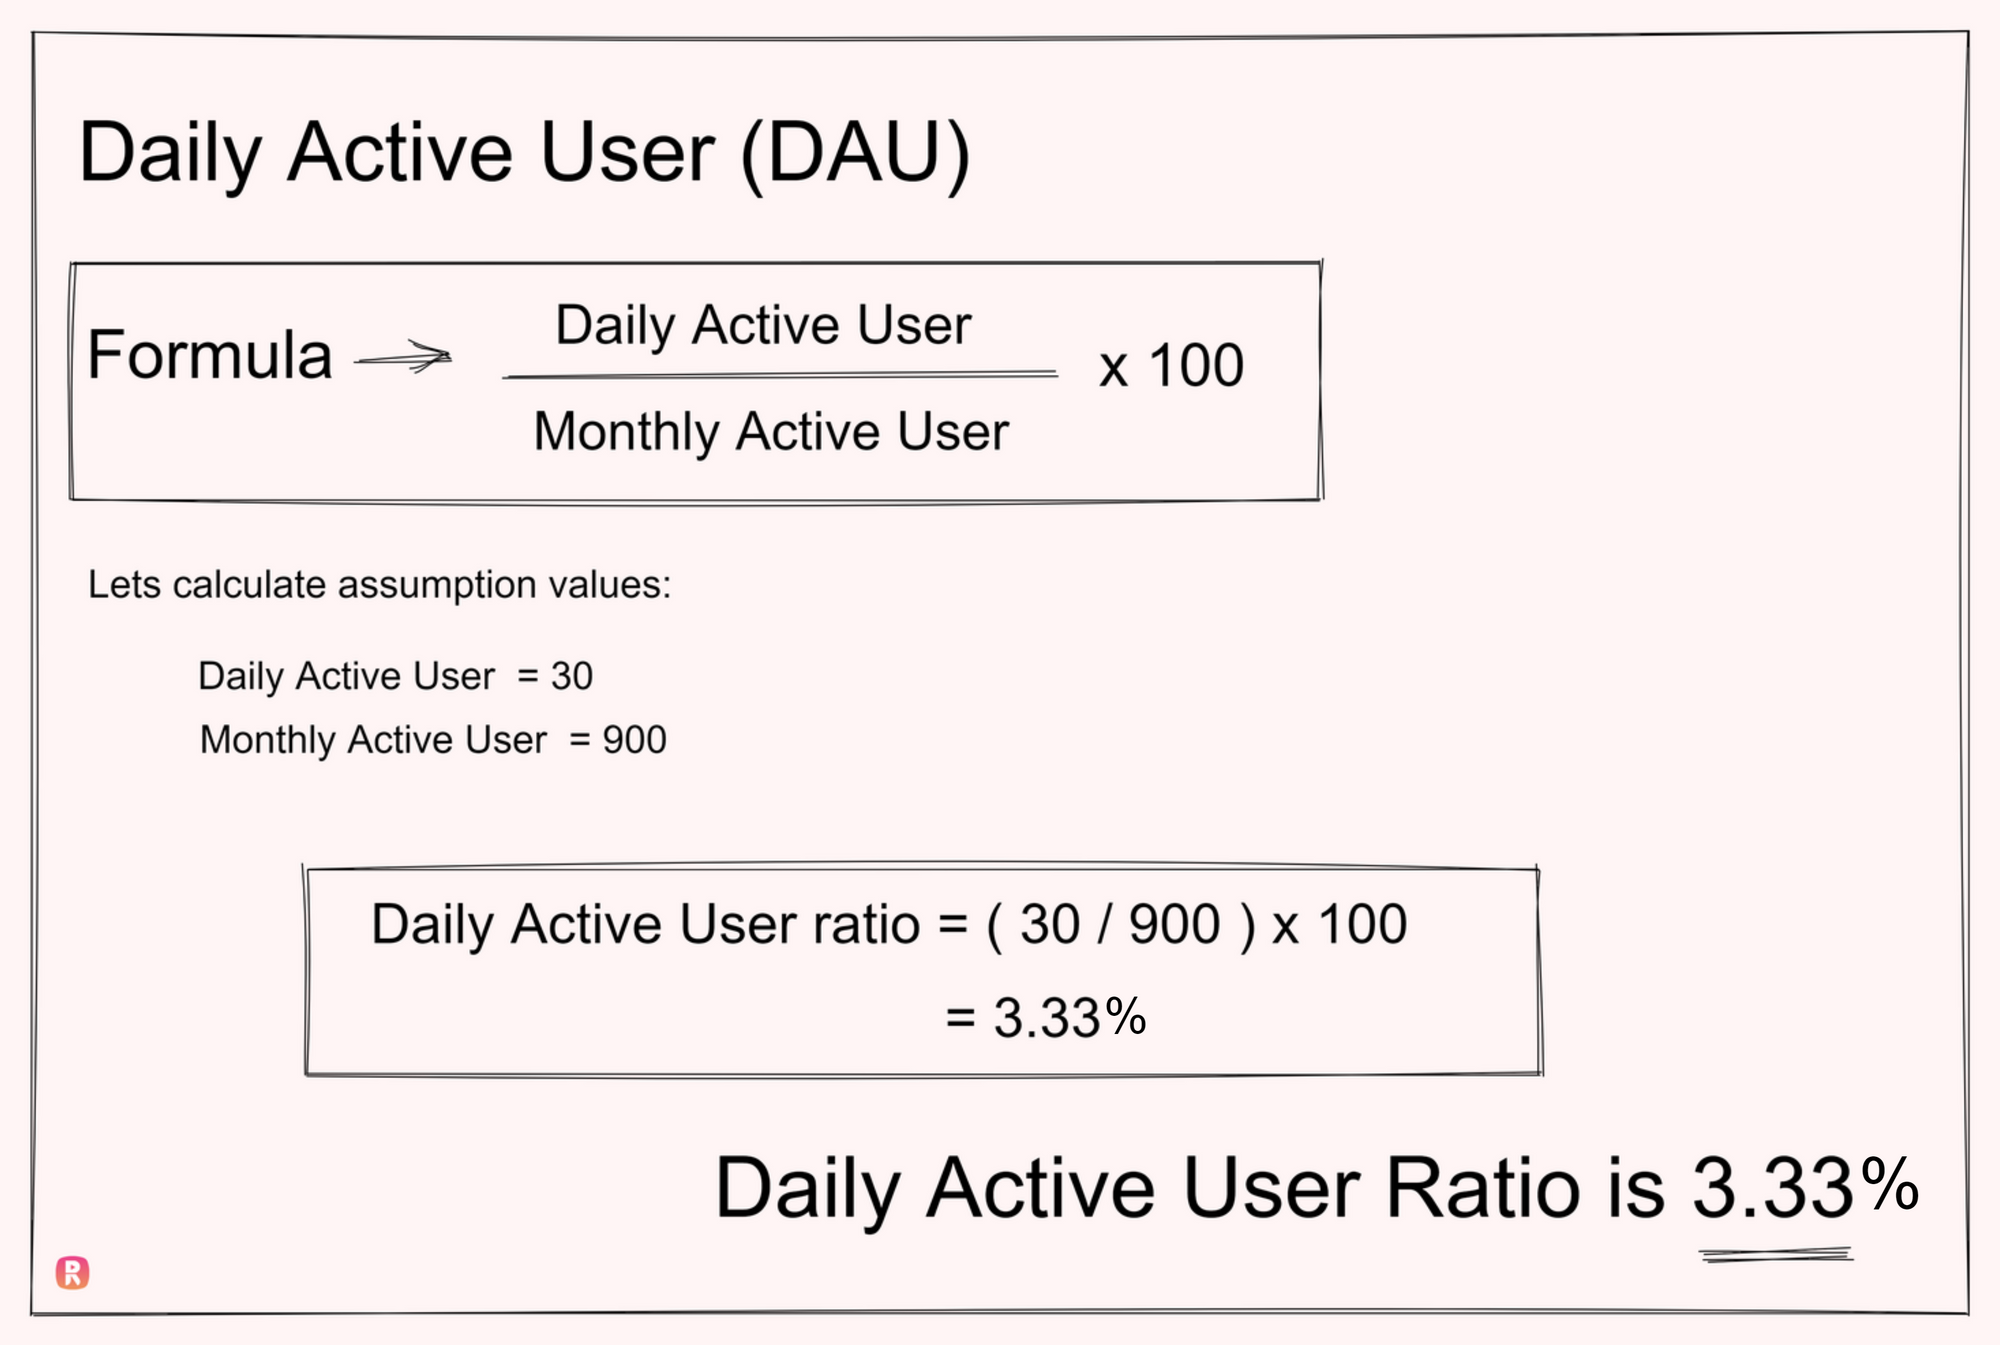
6. Daily Active User (DAU)
Daily Active User or also sometimes Monthly Active User (MAU) measures the number of users who engage with your product. It aims to identify the value your product adds to the customer. It assumes that the more often a customer uses your product the more value they gain out of it.
In SaaS companies, DAU or MAU is used to measure customer retention and also growth.
How to Calculate DAU:
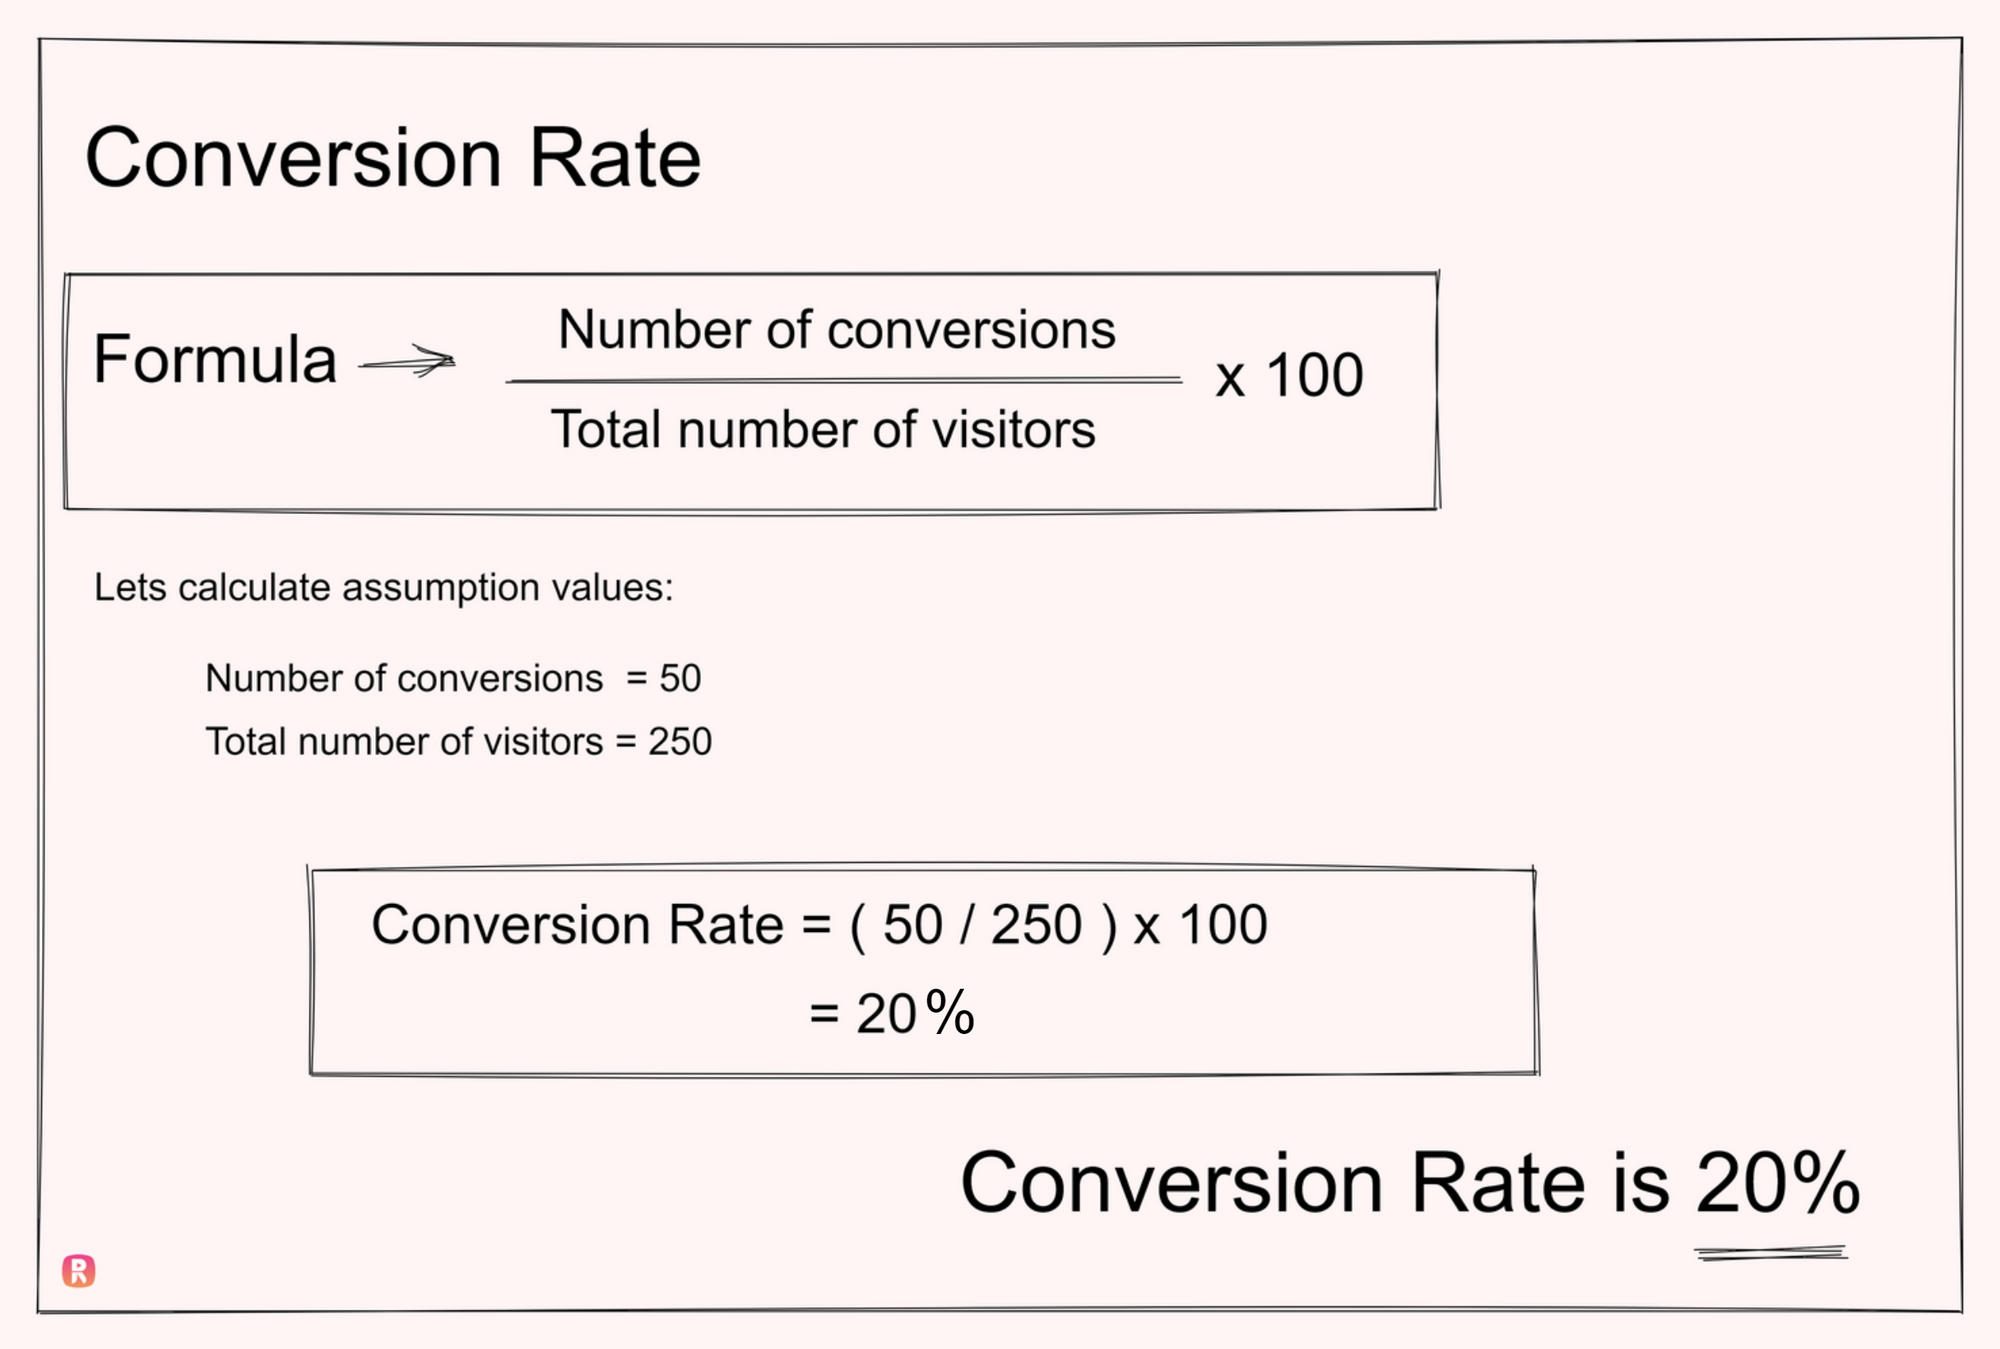
7. Conversion Rate
Conversion Rate refers and measures to how effectively your product guides the customers to take the action that you've set as the target, for example, the action of buying a product, clicking on an advertisement, filling out a form, etc.
How to Calculate Conversion Rate:
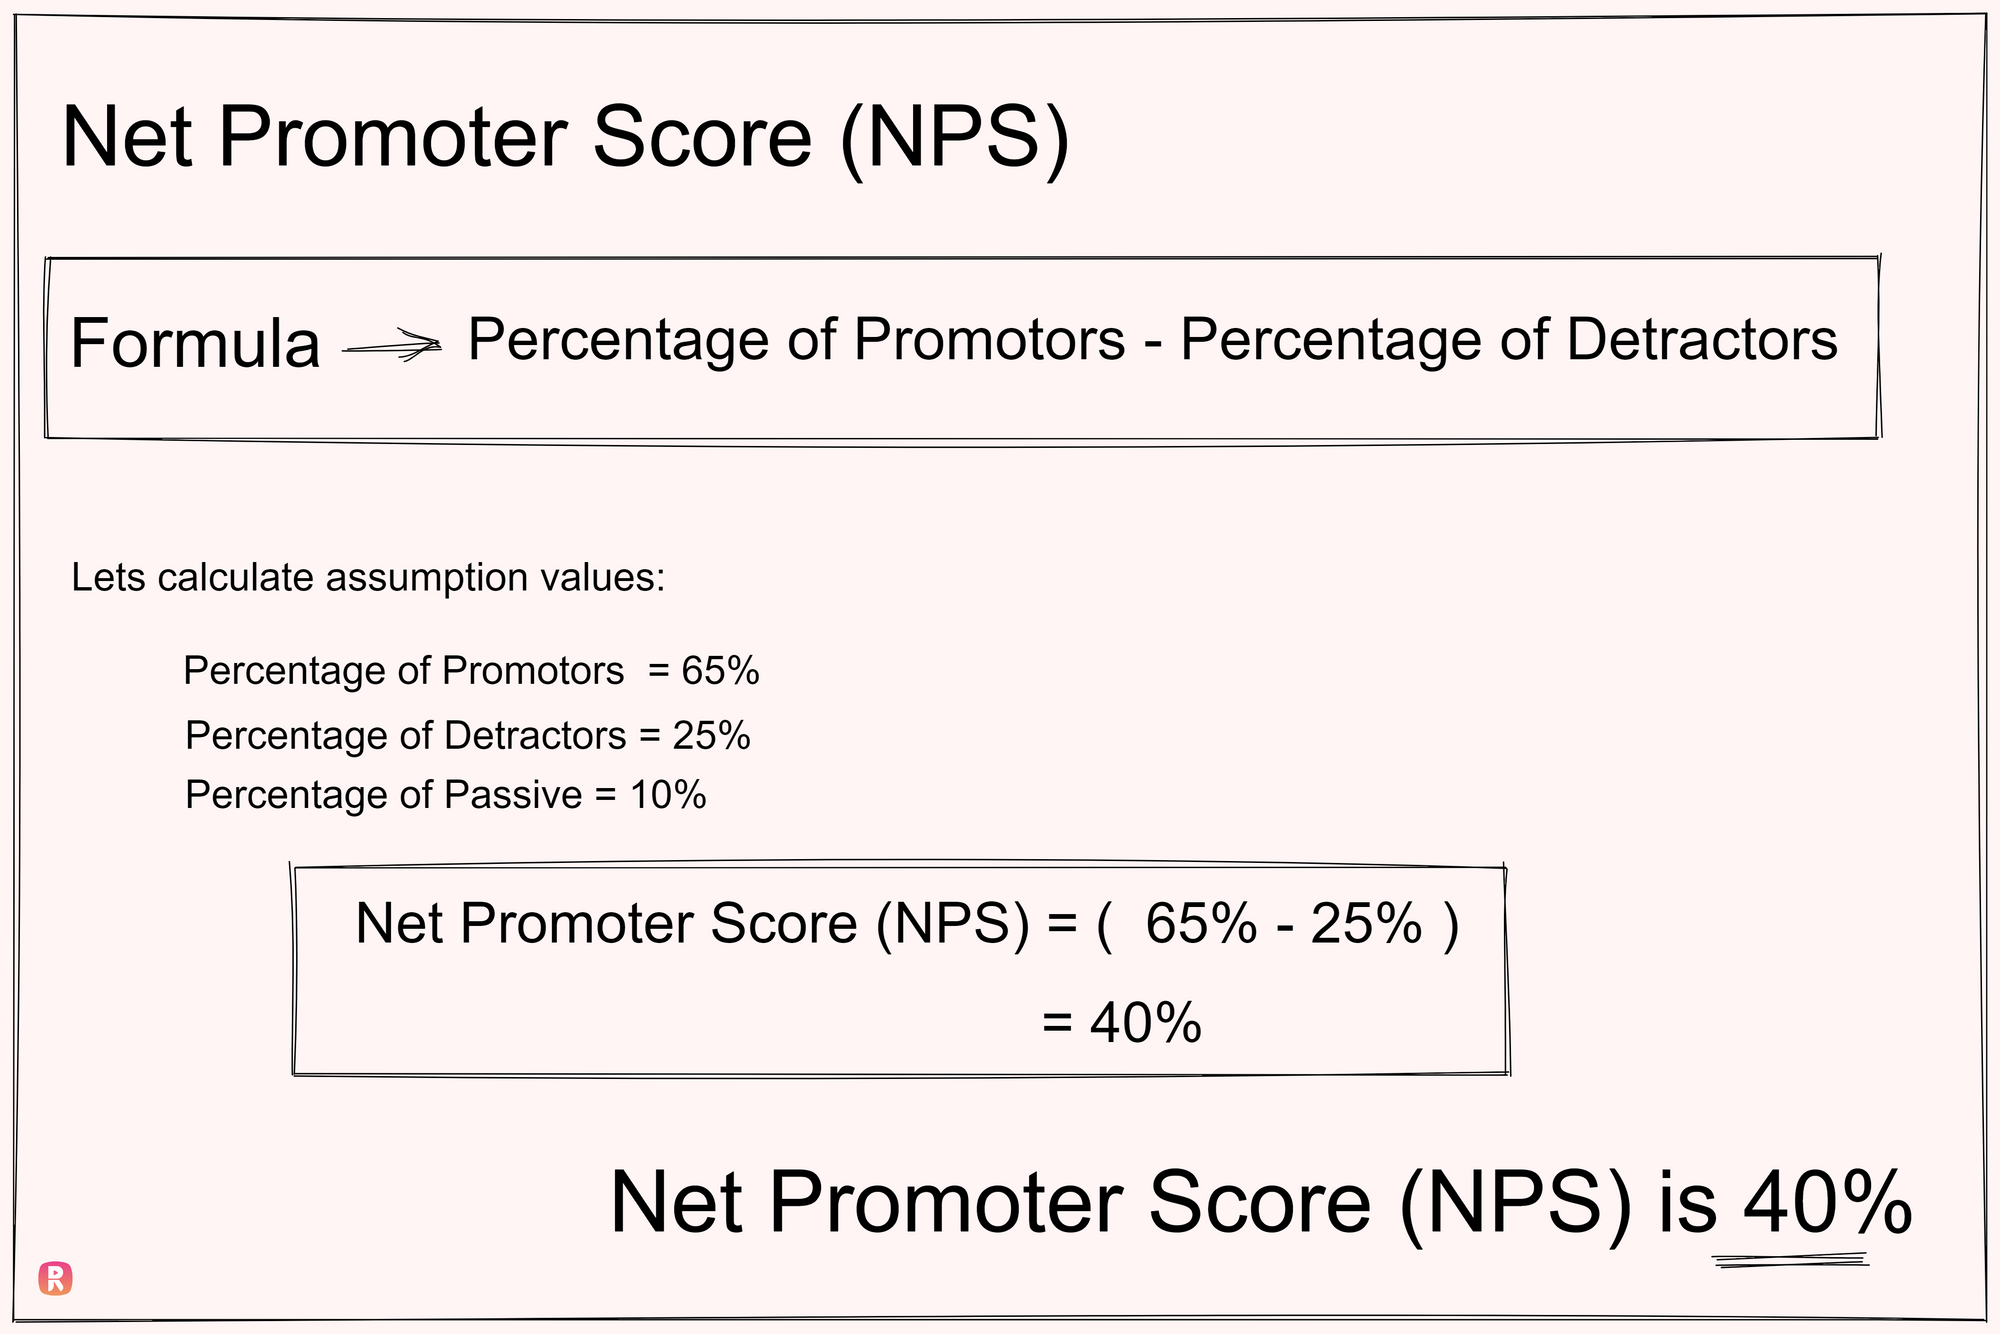
8. Net Promoter Score (NPS)
Net Promoter Score measures satisfaction with a particular feature, product, or brand. The customers rank the products from 0-10 according to their own perception and then they are ranked as promoters, passives, or detractors.
How to calculate NPS:
Which product metrics to avoid?
1. OMTM approach
The OMTM approach is a popular one. It expands to One Metric That Matters, and it is believed by some that by setting one single metric a brand would be able to keep everyone aligned towards the goals set.
This has been busted because firstly, it is impossible to find a single metric that would tell everyone working in the brand what their respective roles would be. This poses a huge risk if it is gotten wrong as it would be a huge loss in terms of energy, time, and even money.
The OMTM approach runs the risk of the brand being unaware of huge issues in their products which will go unseen in your business.
2. Vanity Metrics
Vanity Metrics are ones that look good on paper but unfortunately are not action-oriented. Many brands fall for this and start put by using vanity metrics.
Examples of vanity metrics:
- Bounce Rate: Measures the number of people who leave your website after checking out just one page. But it doesn't tell you why they left and hence it is no good as it gives no solid information.
- Session Duration: Measures the increased time spent on your website by a customer which may indicate engagement but may also reflect as the customer going idle or more often it is confusion caused by bot traffic.
How to pick the right product metrics?
All of these metrics provide information on your customers and product, but which of these are the right ones for your business?
Alas, there is no easy answer to this. The right kind of metrics depends on the kind of customers you have, the product, and the features you provide.
Metrics are more than just numbers, they give insights into customer behavior and track engagement.
For example, if you happen to be in the product team a metric would be the pirate metrics (AARRR).
Wrap up
Teams using metrics can iterate them and use them over time to perfect their products. Perfecting can be done by trial and error.
Testing out various but effective methods by inculcating a scientific approach would help you attain the best analysis.
ReplayBird provides your web analytics and session replay of your website’s digital user behavior for you to watch, analyze, understand and optimize your website to convert more traffic and boost your revenue.
ReplayBird - Driving Revenue and Growth through Actionable Product Insights
ReplayBird is a digital experience analytics platform that offers a comprehensive real-time insights which goes beyond the limitations of traditional web analytics with features such as product analytics, session replay, error analysis, funnel, and path analysis.
With Replaybird, you can capture a complete picture of user behavior, understand their pain points, and improve the overall end-user experience. Session replay feature allows you to watch user sessions in real-time, so you can understand their actions, identify issues and quickly take corrective actions. Error analysis feature helps you identify and resolve javascript errors as they occur, minimizing the negative impact on user experience.
With product analytics feature, you can get deeper insights into how users are interacting with your product and identify opportunities to improve. Drive understanding, action, and trust, leading to improved customer experiences and driving business revenue growth.
Try ReplayBird 14-days free trial
Further Reading
 Afra
Afra Afra
Afra Velantina