ReplayBird is a Google Analytics 4 alternative with a unique approach to web analytics and user experience optimization. As businesses seek to harness the power of data to understand user behavior and enhance digital experiences, ReplayBird emerges as a robust contender in the realm of web analytics solutions.
With ReplayBird's digital user experience features and user-centric focus, ReplayBird presents a compelling option for businesses looking beyond the traditional analytics landscape.
ReplayBird's capabilities in user behavior analysis, session replay, and visual data representation make it a valuable tool for optimizing user experience and driving data-driven decisions.
When used alongside Google Analytics 4 or other analytics platforms, ReplayBird can provide a holistic view of website performance and user engagement.
Let's dive deeper into the comparison of Google Analytics 4 vs ReplayBird:
- What is Google Analytics 4?
- What is ReplayBird?
- Why is ReplayBird a Better Alternative to Google Analytics 4
What is Google Analytics 4?
Google Analytics 4 (GA4) marks a major turning point of web analytics, building upon the foundation laid by its predecessor, Universal Analytics. Launched by Google in October 2020, GA4 introduces a host of advanced features and enhancements, empowering businesses to delve deeper into user behavior and engagement across the ever-expanding digital landscape.
One of the most significant shifts in GA4 is its event-driven data model. Unlike Universal Analytics, which primarily relied on pageviews, GA4 places a strong emphasis on events – actions that users take while interacting with your website,
Events can encompass a wide range of user actions, such as clicks on specific buttons, video views, file downloads, form submissions, and much more. This event-driven approach allows for more granular and flexible tracking of user interactions, enabling businesses to gain a comprehensive view of user engagement.
Moreover, GA4 boasts enhanced cross-platform tracking capabilities, which is especially crucial in today's multi-device world. With users frequently switching between desktops, mobiles, and tablets, GA4 seamlessly stitches together user journeys across various devices. This provides businesses with a holistic understanding of how users interact with their brand, irrespective of the device they use.
Limitations of Google Analytics 4:
- Google Analytics 4 uses data sampling for large datasets, potentially leading to less accurate data representation in complex reports or high traffic situations.
- Google Analytics 4's user interface customization options is more limited than other universal analytics.
- The Google Analytics 4's data retention policies may differ and lower from other universal analytics, requiring users to review and comply with specific retention settings.
- Google Analytics 4 may not have historical data access before its implementation, starting data collection from the implementation date.
- Google Analytics 4's distinct interface and data model might require users familiar with ReplayBird and other universal analytics to adapt to the new features.
- Some Google Analytics 4 features might be in beta, subject to changes and limitations as they undergo testing and refinement.
- Google Analytics 4 might have limitations on data export and availability for external analysis, especially compared to the mature options in other universal analytics.
- As a newer platform, Google Analytics 4 might have fewer third-party integrations compared to ReplayBird and other analytics Analytics.
- Google Analytics 4's different data model and tracking setup compared to other universal analytics create a transition period, potentially leading to incomplete or inconsistent data during migration.
What is ReplayBird?
Google Analytics 4 tool gives you the numbers, metrics and stats. But ReplayBird takes it a step further and helps you dig into the "why" behind those numbers and behaviors with qualitative insights.
ReplayBird is a digital user experience (UX) analytics platform that helps businesses gain valuable insights into how users interact with their digital properties, such as websites.
With advanced data visualization tools like heatmaps and session replays, ReplayBird provides a clear understanding of user behavior, allowing businesses to make data-driven decisions and enhance their digital experiences for improved engagement and conversions.
ReplayBird provides a comprehensive set of 10 features that gives extensive understanding into your digital platform's progress as well as user behaviour.
ReplayBird Features:
#1 Customer Journey Analytics
ReplayBird provides a holistic view of customer journeys, going beyond Google Analytics 4's standard website analytics. By visualizing the entire customer journey, businesses gain deeper insights into user behavior, pain points, and opportunities for improvement, leading to enhanced customer retention and satisfaction.
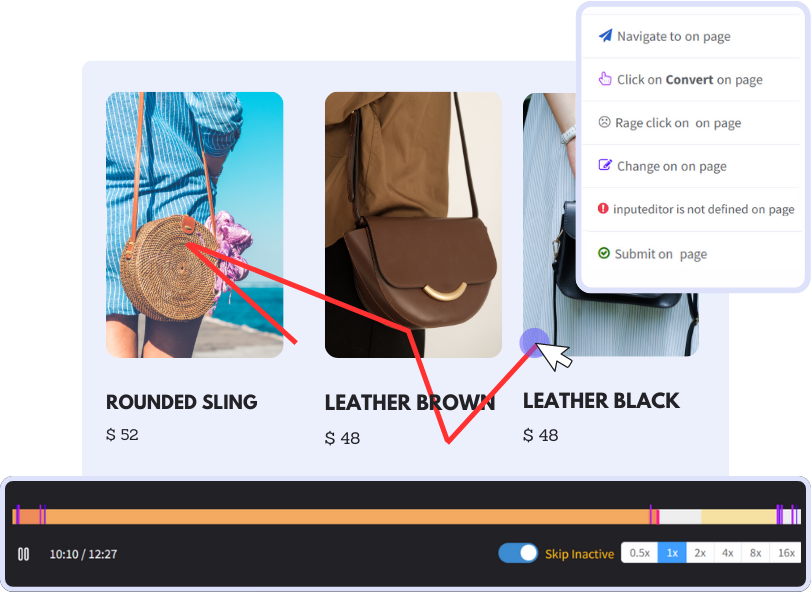
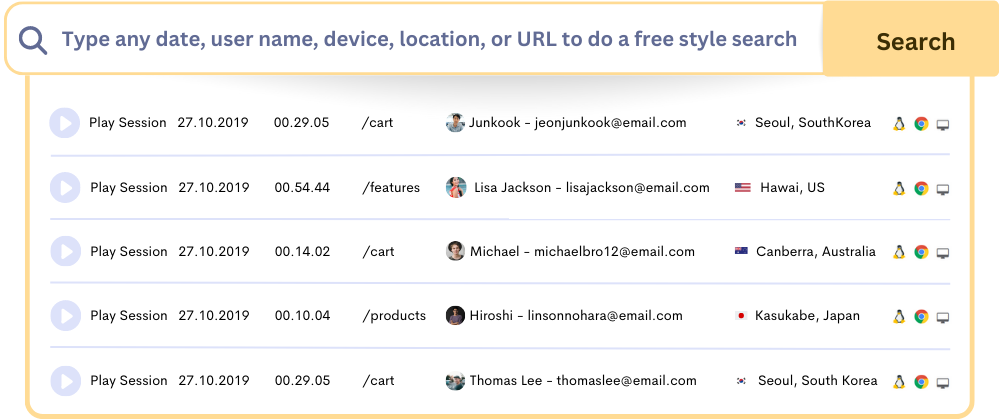
#2 Session Replay
Session replay is a pioneer when it comes to understanding user behavior. ReplayBird allows businesses to capture real-time session replays, offering a visual playback of each user's journey on the website. This feature provides invaluable insights into user actions, motivations, and pain points, enabling businesses to prioritize and address JavaScript errors that might impact user experience.
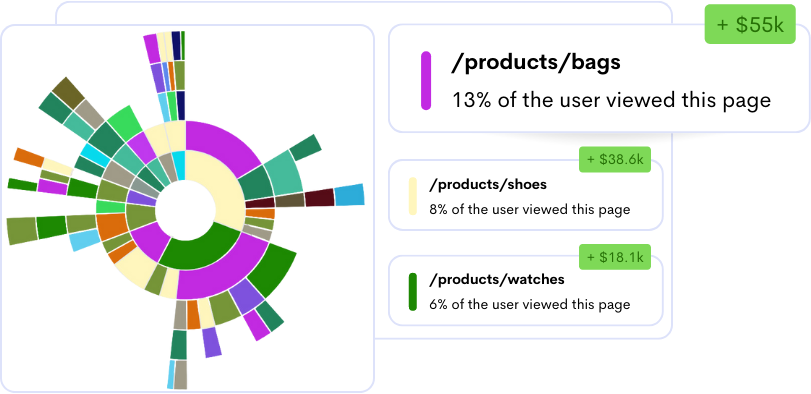
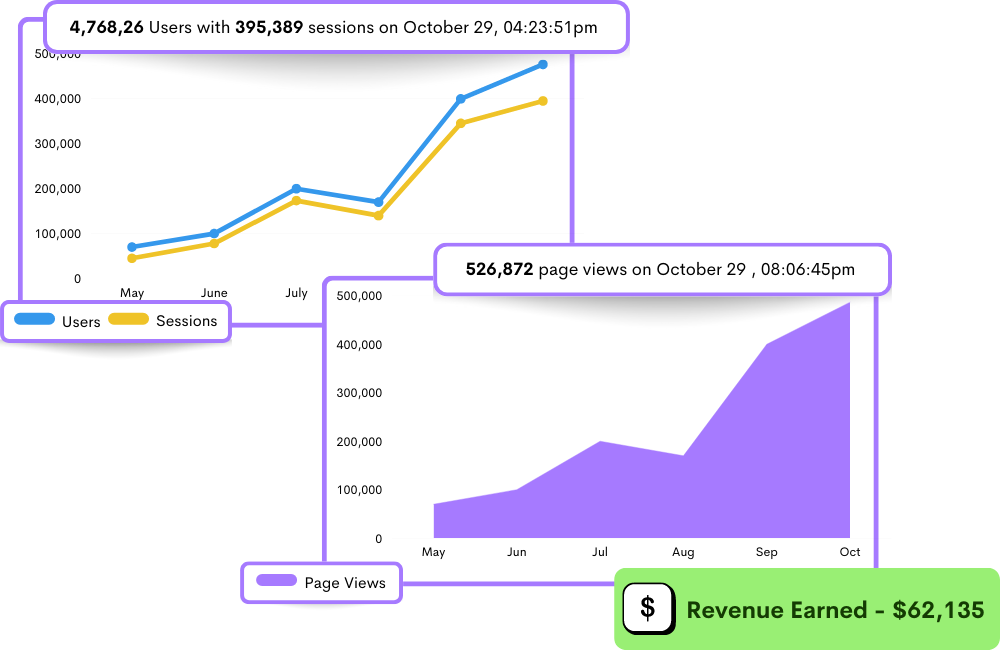
#3 Product Analytics
ReplayBird's Product Analytics feature provides a detailed breakdown of user engagement, enabling businesses to discover how many users actively interact with their digital properties and for how long. Additionally, the insights on JavaScript error tracking, top referrers, OS, device types, and browser usage empower businesses to optimize experiences across different platforms.
#4 Interaction & Heatmaps
ReplayBird's Interaction & Heatmaps feature uncovers user engagement patterns, guiding businesses to optimize navigation, reduce bounce rates, and improve the effectiveness of call-to-action elements. Google Analytics tool doesn't provide the same level of visual insights for understanding user interactions.
#5 Error Analysis
By consolidating error details from various sources, ReplayBird's Error Analysis centralizes error tracking, streamlining the process of issue resolution. This feature enhances the user experience by quickly addressing and resolving errors, which is not available in Google Analytics.
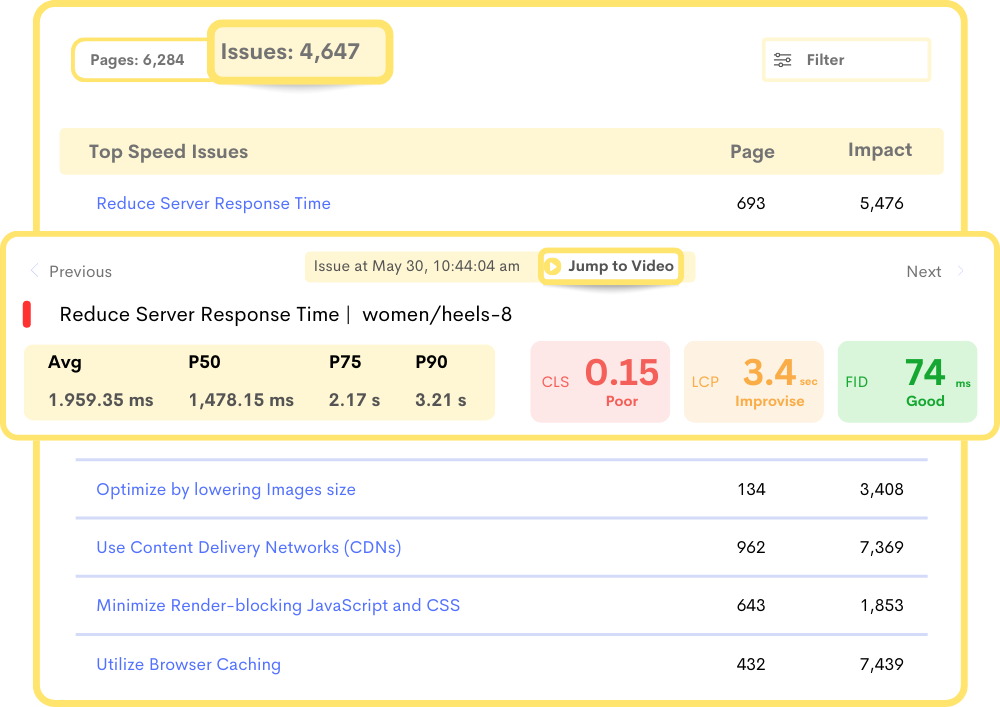
#6 Speed Analysis
ReplayBird's Speed Analysis provides insights on core web vitals and identifies load time issues affecting user experience. By optimizing page loading times, businesses can improve their online presence and user satisfaction, a feature not present in Google Analytics tool.
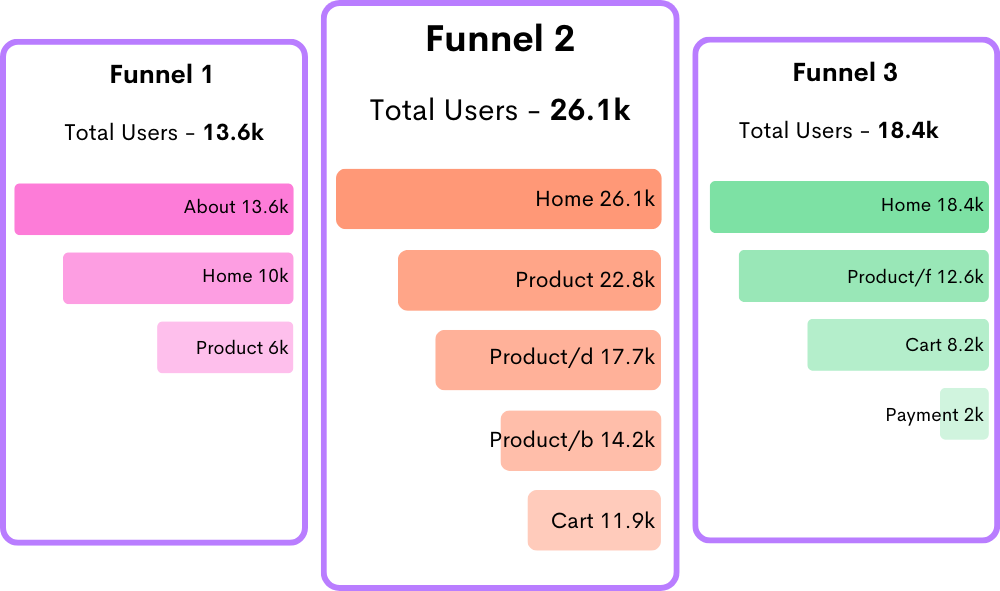
#7 Funnel Analysis
Understanding user behavior throughout the conversion funnel is essential for optimization. ReplayBird's Funnel Analysis feature allows businesses to visualize user paths and identify conversion roadblocks, offering more in-depth insights compared to Google Analytics.
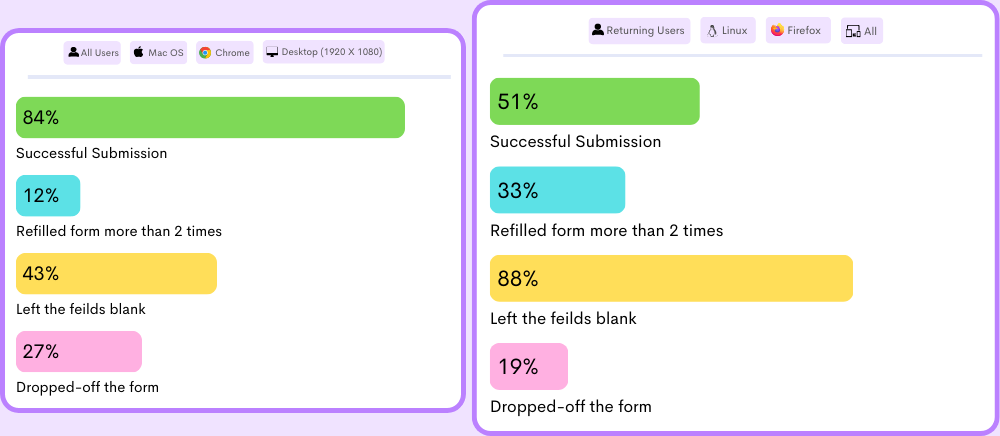
#8 Form Analysis
ReplayBird's Form Analysis helps businesses optimize form completion rates by identifying areas where users abandon forms and effectively tracking form submission errors. Google Analytics does not offer this level of detailed form analytics.
#9 Digital Record Keeping
ReplayBird's automated session categorization simplifies the process for businesses requiring long-term digital record-keeping. Google Analytics tool doesn't have a dedicated feature for this aspect of compliance and dispute resolution.
Why is ReplayBird a Better Alternative to Google Analytics 4
ReplayBird is all about making user experience analysis, more visually qualitative for you to see how users interact with your website through heatmaps, session replays, and helpful behavioral insights. It's like getting a virtual tour of your users' experiences!
Not only that, but ReplayBird also gives you super-detailed data about how users behave on your digital platforms, way more than what you'd find in Google Analytics tool. This means you can really dig deep into understanding user journeys, engagement levels, and conversion funnels.
1. Dashboard
ReplayBird's dashboard has some unique features that users often find beneficial compared to Google Analytics 4. Here are some reasons why ReplayBird's dashboard might be considered better:
- ReplayBird's dashboard is so easy to use in contrast to Google Analytics 4 which is confusing, with overwhelming mettrics and data.
- About Google Analytics 4 dashboard, it is more about data on just number of users, whereas ReplayBird dashboard is more about user experience analysis
- ReplayBird gives you super-detailed data about user behavior, like really zooming in on user journeys and interactions. This helps you understand what your users love, spot trends, and identify where conversions might be getting stuck.
- Google analytics tool gives you irrelevent massive metrics whereas, ReplayBird makes it all easy as an alternative to Google Analytics 4! Their dashboard is so user-friendly that anyone on your team
- ReplayBird lets you create reports tailored just for you. You get to focus on the metrics that matter most, so you're not drowning in irrelevant data.
Let's compare the dashboard insights provided by both Google Analytics 4 and ReplayBird.
| ReplayBird Dashboard Consists of | Google Analytics 4 Dashboard Consists of |
|---|---|
| |
|
| |
|
| |
|
| |
|
| |
|
| |
|
| |
|
| |
|
| |
|
| |
2. Quantitative Analytics Features
Let's dive into the comparison between ReplayBird and Google Analytics when it comes to Quantitative Analytics Features:
- Granularity of Data: Google Analytics tool gives comprehensive data, but ReplayBird's focus on granularity means you get even more specific insights into user journeys and actions.
- Visual Representation: Google Analytics tool does offer visualizations too, but ReplayBird's visual appeal being more user-friendly and interactive visualizations like heatmaps and session replays, making it super easy to understand and analyze your data in a flash.
- User Experience Analysis: Google Analytics tool does have user behavior analysis, but ReplayBird's focus on user experience optimization with features like heatmaps and session replays, that help you understand user behavior and identify pain points.
- Real-time Analytics: Google Analytics tool has real-time reporting too, but ReplayBird's real-time capabilities may be more comprehensive and suitable for businesses needing up-to-the-minute insights.
- Form Analytics: Google Analytics tool does track forms, but ReplayBird's form analytics might give you even more specific insights and metrics.
- E-commerce Analytics: They offer e-commerce Google Analytics tracking too, but ReplayBird's e-commerce analytics are geared towards the specific needs of e-commerce businesses including product performance analysis and cart abandonment tracking, tailored just for online retailers.
- Customization and Segmentation: Google Analytics tool also supports data segmentation and customization, but ReplayBird might be more user-friendly and specialized in this area.
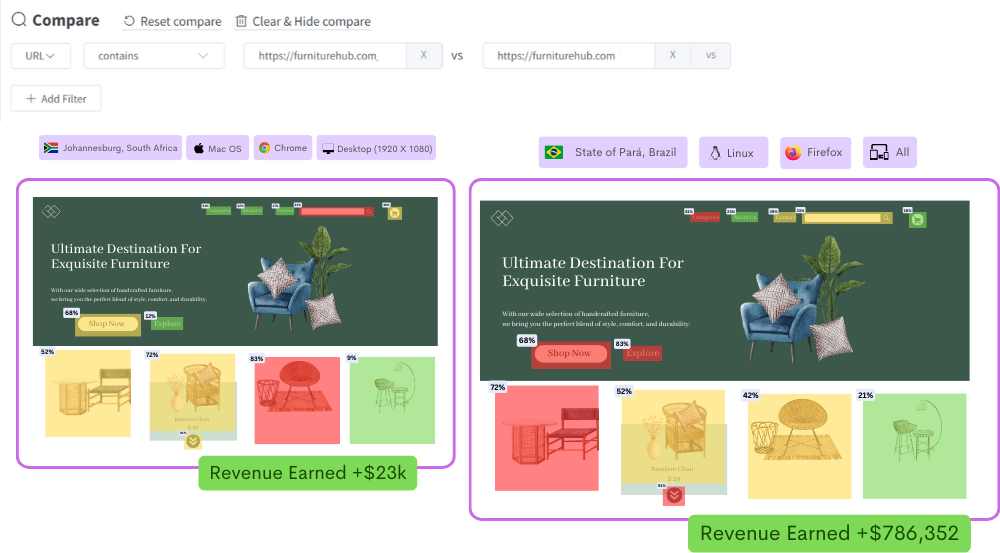
3. User Interface and Data Visualization
Both Google Analytics and ReplayBird have user-friendly interfaces, but ReplayBird stands out with its visually appealing and interactive design, specifically tailored for user experience analysis. While Google Analytics offers a comprehensive set of data, ReplayBird's emphasis on engaging visualizations like heatmaps and session replays sets it apart.
Let's compare the User Interface (UI) and Data Visualization of Google Analytics and ReplayBird:
User Interface:
-
Google Analytics 4:
Google Analytics 4 has a user-friendly and intuitive interface that is designed to cater to a wide range of users, from beginners to advanced analysts.
The dashboard presents various reports and data in a structured manner, making it easy to navigate and access different insights.
About Google Analytics, it offers a menu-driven interface, allowing users to explore different sections, such as Audience, Acquisition, Behavior, and Conversions.
It also provides customization options, allowing users to personalize their dashboards and reports based on their preferences. -
ReplayBird:
ReplayBird is known for its visually appealing and engaging user interface. The platform places a strong emphasis on data visualization, using interactive and attractive visualizations like heatmaps, session replays, and funnels.
The UI is designed to make data analysis more enjoyable and straightforward, with a focus on providing insights at a glance.
ReplayBird's UI is optimized for user experience analysis, offering features that cater to marketers, UX designers, and analysts alike.
Data Visualization:
-
Google Analytics 4:
Google Analytics provides a range of data visualization options, including line charts, bar graphs, pie charts, and tables.
The platform offers standard visualizations for various reports, making it easier to understand website traffic, user demographics, and behavior.
While the visualizations are functional and informative, they are more traditional in style, focused on conveying data efficiently rather than emphasizing visual appeal. -
ReplayBird:
ReplayBird shines in data visualization, offering highly engaging and interactive visualizations. Heatmaps are a standout feature, allowing businesses to see user interactions displayed as color-coded overlays on their web pages.
Session replays provide a video-like playback of user sessions, helping visualize user behavior in real-time.
ReplayBird's visualizations are designed to provide insights quickly, making it easier for businesses to identify areas for optimization and user experience improvement.
5. Data Analysis and Reporting
Google Analytics excels in providing a comprehensive analytics platform that covers a wide range of website metrics and marketing analysis. On the other hand, ReplayBird specializes in user experience analysis, offering visually engaging data visualizations and insights to optimize user journeys and enhance website usability.
Data Analysis:
-
Google Analytics 4:
Google Analytics 4 offers a comprehensive suite of data analysis tools that cover a wide range of website metrics. It provides pre-built reports and dimensions that allow you to delve into website traffic, user behavior, conversion funnels, and audience demographics. The platform is well-suited for businesses looking for an all-encompassing analytics solution that caters to various aspects of website performance and marketing analysis. -
ReplayBird:
ReplayBird an alternative to Google Analytics 4 specializes in user experience analysis, offering unique data analysis features that focus on understanding how users interact with your website. With interactive visualizations like heatmaps, session replays, and form analytics, ReplayBird excels in providing actionable insights for optimizing user experience and identifying areas for improvement.
Reporting:
-
Google Analytics 4:
Google Analytics 4 provides extensive reporting capabilities, allowing you to create custom reports and dashboards tailored to your specific needs. The platform offers data through charts, graphs, and tables. Automated reporting features enable you to schedule reports and receive them regularly via email, making it convenient for regular monitoring and reporting. -
ReplayBird:
ReplayBird's reporting is centered around captivating visualizations, like heatmaps and session replays, offer an engaging and intuitive way to present data, making complex information more accessible. ReplayBird's reports focus on user experience analysis, empowering businesses to make data-driven decisions to enhance website usability and overall user satisfaction.
6. Integrations and Third-Party Support
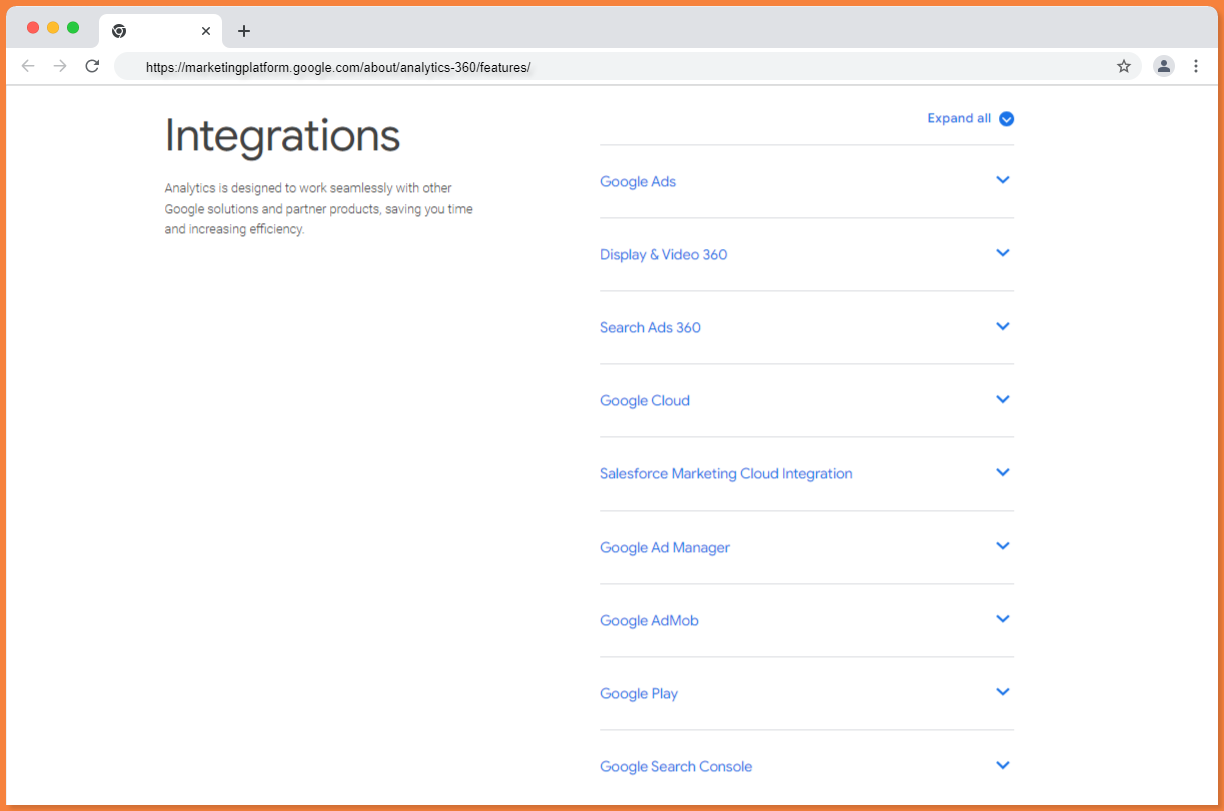
Google Analytics 4 Integrations and Third-Party Support
Google Analytics 4 offers a wide array of integrations and third-party support within the other google products, making it a versatil analytics platform. These integrations allow businesses to extend the capabilities of Google Analytics 4, and connect it with other tools.
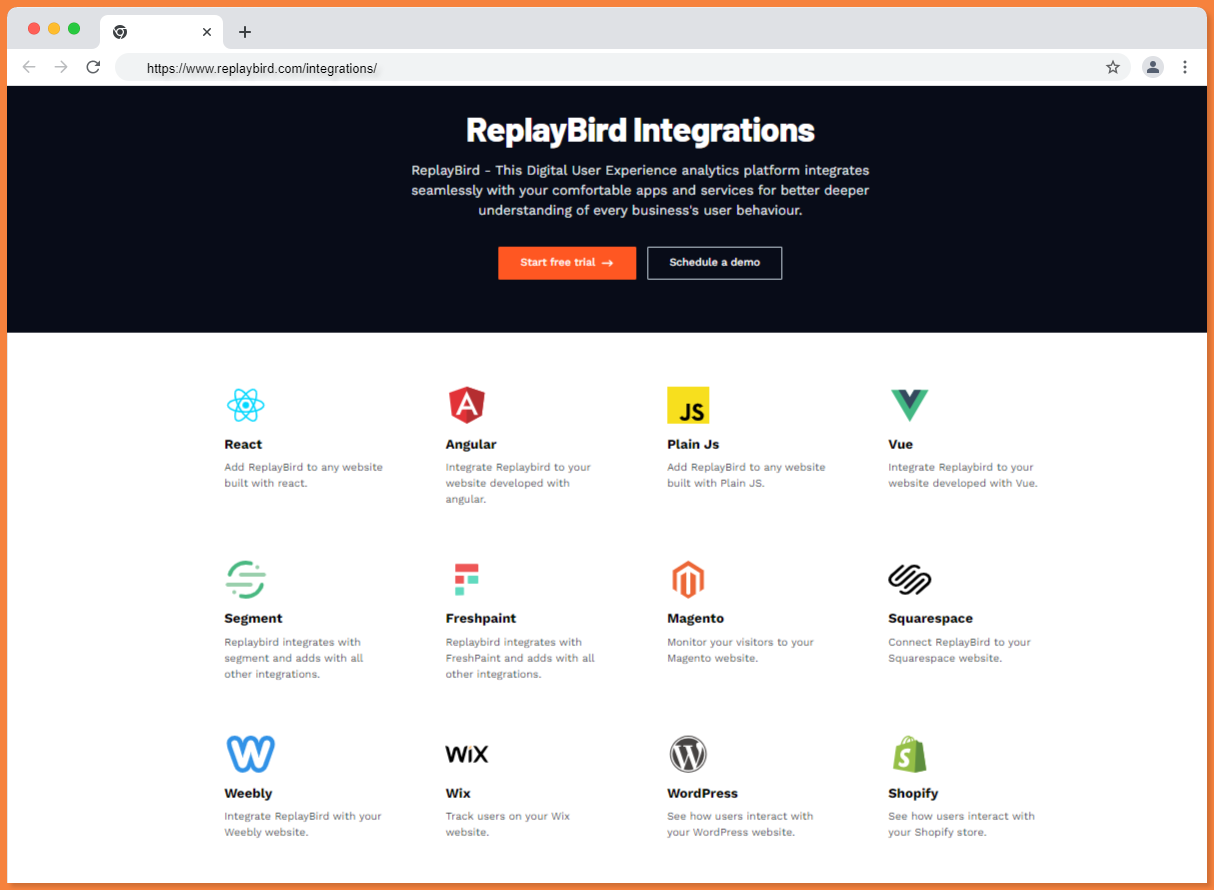
ReplayBird Integrations and Third-Party Support
ReplayBird's integrations and third-party support provide businesses with flexibility and scalability, enabling them to customize their analytics setup to meet their unique needs and extract the most valuable insights from their data. These integrations empower businesses to make more informed decisions, optimize their digital strategies, and improve overall performance.
7. Pricing
Google Analytics 4 Pricing:
- Google Analytics 4 (Free Version):
Google Analytics has a totally free version which is available to everyone, with no cost involved. This version is perfect for small to medium-sized businesses and individuals who want to understand their audience better and optimize their online presence. - Google Analytics 360 (Premium Version):
About Google Analytics 360, it is the premium version of Google Analytics, designed for the big businessess and enterprises. While it comes with a subscription cost, it offers some advanced features that go beyond the free version. The pricing depends on factors like how much data you need to process and the specific needs of your business.
ReplayBird Pricing:
ReplayBird an alternative to Google Analytics offers a range of pricing options, making it suitable for businesses of all sizes. Here are the different ReplayBird pricing plans available:
- Free trial for 14 days
- Basic is for $49 per month
- Startup is for $99 per month
- Growth is for $299 per month
- Professional is for $499 per month
- Premium is for $799 per month
- Custom Pricing is also available.
Conclusion:
ReplayBird, an amazing alternative to Google Analytics 4 that offers a whole new perspective on user behavior analysis and session replay. If you're all about understanding how users engage with your website and optimizing their experience, then ReplayBird is the best choice!
With ReplayBird's focus on user behavior analysis, you get real-time or near-real-time insights into your users' actions on your website.
The best part? ReplayBird is a perfect complement to Google Analytics 4. While Google Analytics 4 gives you the big picture of your website's traffic and overall performance, ReplayBird an alternative to Google Analytics 4 zooms in on user behavior, adding an extra layer of insights that can take your data analysis to a whole new level.
Whether you're a small business, a growing startup, or a big enterprise, ReplayBird has a pricing plan just for you. From a generous 14-day free trial to customizable options, it's designed to cater to your needs and fit right into your budget.
Keep Reading about Google Analytics and Comparisons:
 Velantina
 Velantina
 Velantina