Product usage is a critical factor in determining the success of any product or service. Therefore, businesses must understand the usage patterns of their customers and how they interact with the product.
By understanding these patterns, businesses can ensure customers can access an optimal customer experience. Additionally, product usage data can inform product decisions, help optimize pricing strategies, and support market research initiatives.
In this blog post, we will discuss why it is important to measure customer usage, how to measure product usage, and how to use the data to improve the customer experience.
- What is product usage?
- Why product usage is important?
- How to track product usage?
- What are product usage metrics?
- Uses of product usage metrics
What is product usage?
Product usage refers to the data about the details of how your customers are using your product. Simply, it is the data of how and when your customers are using your products.
Products and services in the digitalized world require a comprehensive understanding of customer behavior to cope with current trends.
These software products and services are distinctive, for which the product usage data is beneficial and add value to your company's top-level operations.
This is a valuable tool for measuring customer activities, leading to a better understanding of them. This data enables efficient decision-making for your company.
Why product usage is important?
Product usage data gives valuable insight into how your customers are using your product.
Thereby, this gives a measure of the ways your customers interact with your product or service.
This data proves to be helpful in the following manner:
- Finds deviations - Product data usage helps find errors in your product, thereby enabling you to identify deviations from standard performance.
- Measuring product performance - This data measures the actual performance of your product which helps correct deviations or errors.
- Enhance your product quality - Since this data is valuable in the measurement of product performance, it moreover gives inferences as to how you can develop your product in terms of its standards and quality.
- Improves user satisfaction - Better the quality, better the user satisfaction with your products. Product usage data is inherent in product development and customer services, which leads to improved customer satisfaction.
- Customer retention - Product usage data helps your company to improve user experience and satisfaction, which thereby leads to more customers being retained.
How to track product usage?
To measure your product usage, choosing a metric that clearly describes your customer engagement with your products or services is essential.
It would help if you avoided simple metrics like the number of daily logins since this doesn't show how your product is being used. Thereby, valuable metrics are to be chosen to measure your product usage.
You can use several methods and tools to track product usage, depending on the type of product or service you are offering and the metrics you want to track. Here are a few examples:
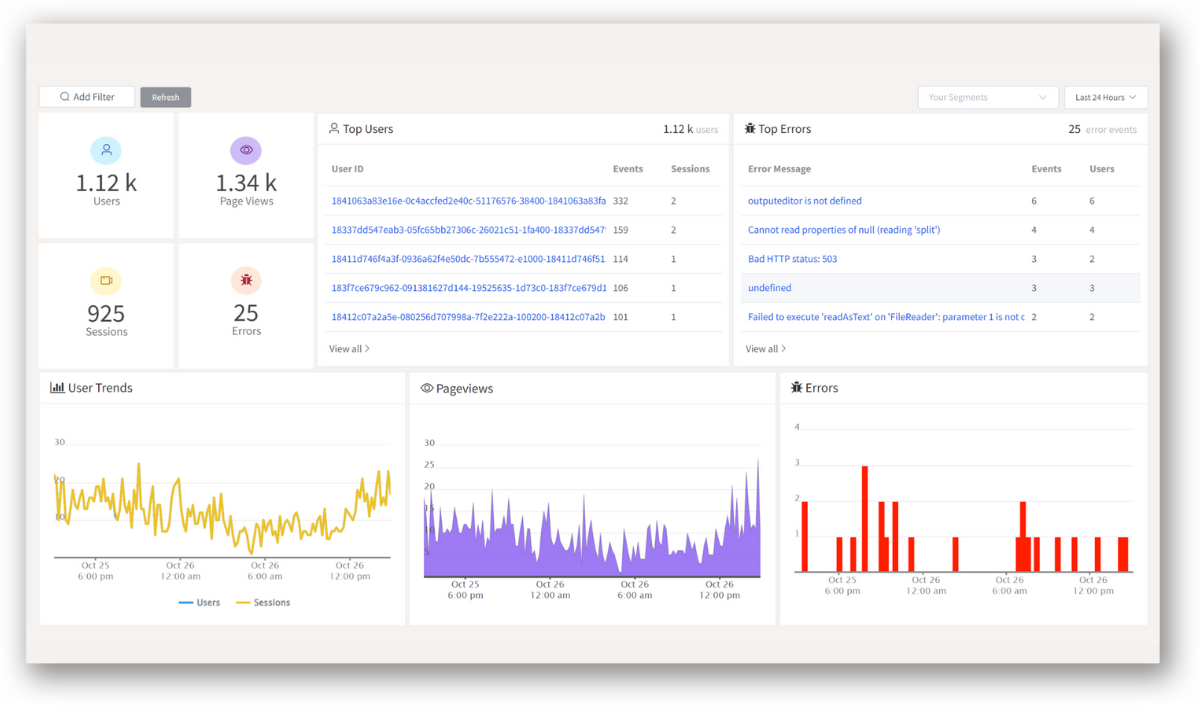
- Product analytics tools: Product analytics tools such as ReplayBird can track product usage data, including user behavior, engagement, and conversion rates. These tools can help you understand how users interact with your product and where they may encounter issues.
- Customer feedback: Surveys, feedback forms, and user testing can help you collect feedback directly from customers about their experience using your product. This can provide valuable insights into areas for improvement and help you identify what is working well.
- A/B testing: A/B testing involves testing two different versions of a product or feature with a sample of users to see which performs better. A/B testing can help you identify the most practical features that need improvement.
- User segmentation: Segmenting users based on demographics, behavior, and engagement can help you understand how different users use your product. This can help you tailor your product to meet the needs of specific user groups and improve the overall user experience.
- Event tracking: Tracking specific user events, such as sign-ups, logins, and purchases, can help you understand how users are moving through your product and identify areas where they may be dropping off.
These applications or digital tools collect raw data, process them, and analyze them to make inferences. These interpretations are visually represented in the form of graphical charts.
Therefore, this kind of software helps you right from raw data processing to the generation of reports.
What are product usage metrics?
Product usage metrics are measurements used to track how customers use a product or service. They are typically used to gain insights into how customers interact with the product and how they derive value from it.
Product usage metrics are important for understanding customer behavior, identifying areas for improvement, and making data-driven decisions that can drive growth and success.
Let us look at the useful product usage metrics below:
1. Usage Frequency
This metric describes how often your customers are using your products. The customers' regularity in product usage can be inferred from this metric.
Usage frequency can be measured in a variety of ways depending on the type of product and the desired level of granularity.
Example: For a mobile app, usage frequency could be measured as the number of times the app is opened per day or per week. For a subscription-based service, usage frequency could be measured as the number of times a user logs in or accesses the service within a given month.
By tracking usage frequency, businesses can gain insights into user behavior and identify opportunities to improve their product.
- If usage frequency is low, businesses might consider adding new features or improving the user experience to encourage more frequent use.
- If usage frequency is high, a business might focus on ways to increase the value of each individual user session, such as by offering personalized recommendations or upselling additional products or services.
2. Time spent in using the product
This product usage metric gives insights into how well your user experience is. The long period of time spent on your product or service indicates that the customer is having a good experience with your products. On the contrary, a shorter period reflects the need for product development and user experience.
Time spent using a product can be measured in a variety of ways, depending on the nature of the product and the desired level of granularity. In a website, time spent could be measured as the total amount of time spent logged in and actively engaged with the service.
By tracking time spent using a product, businesses can gain insights into how users are engaging with their product and identify opportunities to improve user engagement and satisfaction.
- If users are spending a lot of time using a particular feature or aspect of the product, a business might consider investing in improvements to that feature to make it even more valuable to users.
- If users are spending very little time using the product overall, a business might consider redesigning the user interface or adding new features to increase engagement and usage.
3. Customer retention
Customer retention refers to the rate at which your customers are retained. This indicates your product performance and reflects customers' interest in using your products.
Customer retention is the process of actively engaging with existing customers to retain their loyalty and ensure that they continue to purchase products or services from the company.
This can be achieved through various methods, such as providing high-quality customer service, discounts or loyalty programs, and a personalized customer experience.
Additionally, customer retention can be improved through targeted marketing campaigns and personalized communications that help keep customers informed and engaged.
Read More: What is Customer Retention? Everything you need to know
4. Churn rate
It refers to the rate at which your customers stop using your products/services. Companies reduce their churn rate through product innovation and marketing efforts.
This measure is indicative of the customers' aversion to your services and dictates the need for upskilling.
Churn rate is a critical metric for businesses because it can help them understand how well they are retaining their users and how much growth they can expect in the future.
High churn rates can indicate that users are dissatisfied with the product or that it is not meeting their needs, while low churn rates suggest that users are happy and engaged with the product.
By tracking churn rate, businesses can identify areas for improvement in their product and take action to reduce churn.
Businesses might invest in improving the user experience or adding new features to address user pain points and improve retention. They might also focus on increasing engagement and providing users with more value to keep them using the product over time.
5. Product onboarding engagement rate
You can communicate with your users inside the app, which creates an impact on your product usage. Your product (application) might have many features you want your customers to use to add value to your business.
The revenue-generating features could be an in-app purchase that you provide, and the number of customers using those value-adding features determines how well they are using your product.
Let us look at the three stages of product onboarding:
- Primary onboarding - It concentrates on getting customers to use your key features. For instance, getting customers to install applications and play is a primary onboarding for gaming platforms.
- Secondary onboarding - It focuses on getting the customers to use your additional value-adding features. For instance, making customers play advertisements in an application so that they can earn rewards is a secondary onboarding for gaming platforms. Moreover, making customers purchase rewards for money is a value-adding feature for gaming companies.
- Tertiary onboarding - This focuses on product expansion through word of mouth, i.e., reviews. For instance, getting ratings and reviews from customers from inside the application or asking customers to rate using Google Play links is a method of tertiary onboarding. This measurement dictates the in-app experiences of the users, which impact the ultimate behavior of the customers. Thereby, it is a key indicator of product usage since it clearly depicts the level of user engagement.
You can measure user behavior in each stage of product onboarding engagement.
For instance, you can measure the number of customers you have successfully acquired through your primary onboarding.
Secondly, you can measure the number of customers who were willing to pay the price for your products or services, ultimately adding value to your business.
Lastly, you can check the reviews from the customers, which dictate their views or opinion on your business.
You can calculate your product onboarding engagement rate in a few ways. Let us look at them below:
- Percentage of users that complete the onboarding process/%Users that start the onboarding process.
- Percentage of users that achieve all the onboarding goals within 24 hours after sign up/percentage of users that go through the entire onboarding process.
- The median value of key tasks completed/Number of key onboarding tasks to complete
- Product activation rate.
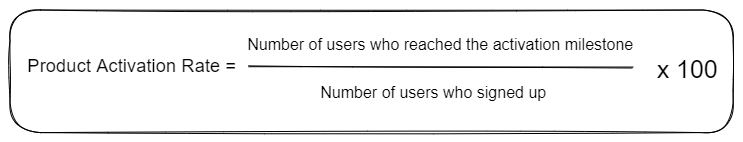
6. Product activation rate
The term 'activation' here talks about the value-adding element of your business, which is influenced by the primary onboarding.
Henceforth, it varies depending on the nature of the business.
For an e-commerce platform, the purchase of products creates value for the business. For a gaming platform, the number of in-app purchases or account activation could be a value-adding element.
It is calculated as,
7. Product adoption
Product adoption refers to the journey of users in adapting to your product. It involves the steps starting right from user activation to becoming a product advocate. This specifies the engagement of users in detail.
Product adoption is essential for businesses because it can help them understand how quickly their product is gaining traction and how well it meets user needs.
High adoption rates suggest that users are finding value in the product and are eager to start using it, while low adoption rates suggest that users may be hesitant to try the product or may not meet their needs.
By tracking product adoption, businesses can identify areas where they may need to focus their efforts to improve adoption rates.
Example: Businesses might invest in marketing to increase awareness of the product or feature or focus on improving the onboarding experience to make it easier for users to get started. They might also consider adding new features or functionality to the product to make it more appealing to users and encourage adoption.
Read More: What is Product Adoption & How To Measure It?
8. Time to value
Time of value refers to the time taken by the users to experience value in your products or services. The lesser time it takes, the more benefits for you and as well as your users.
If it takes a user a long time to realize the full value of a product or service, they may be more likely to become frustrated or disengaged and stop using the product altogether.
Simultaneously, if a user can quickly see the value of a product, they are more likely to continue using it over time.
Time to value can be measured in a variety of ways, depending on the nature of the product and the desired level of granularity.
Time to value might be measured as the time it takes for a user to start seeing measurable improvements in their business or personal life as a result of using the service.
9. Number of key user actions per session
This refers to the number of key action taken by the user and this key action changes according to the nature of business. For instance, key actions for e-commerce platform could be:
- Completing purchases
- Recurring purchases
- Receiving reviews or ratings for products
Tracking your key actions will tell you if the customers are finding value in your products and services, which will best describe the product usage.
10. Customer engagement score
This refers to a quantitative measure of your users' engagement level. Here, customers get scores based on their level of product usage i.e. higher the usage, the higher the score, and vice-versa.
11. Feature usage
It refers to the number of users using your specified features. This gives a detailed measure of how your customers are using your products through an analysis of the usage of product features.
It is calculated as,
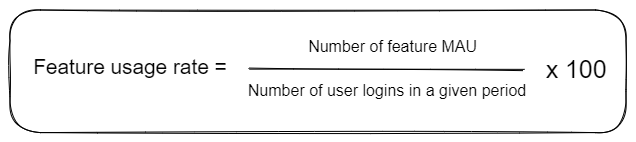
(Note: MAU here refers to Monthly Active Users)
It is advisable to measure feature usage by cohorts i.e. grouping users on the basis of characteristics. This will give you an idea of the features preferred by customers with regard to their characteristics or behavior.
12. Product usage stickiness
Stickiness is a simple measure of dividing your Daily Active Users (DAU) by your Monthly Active Users (MAU).
This implies,
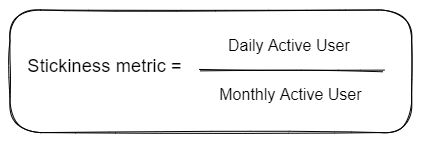
i.e. DAU to MAU ratio
Uses of product usage metrics
Product usage data, when formed properly, can provide valuable insights which help in key functions of your company, such as decision-making. It can be used by:
- Finance Manager
- Product Manager
- Sales Manager
- Marketing Manager
- Research and Development Heads
- Creative Team
Let us have a look at their uses in brief below:
a) Identifies customer trends
Product usage data depicts a clear picture of the behavior of the customers and how they are utilizing your product. Thereby, it gives you a data visualization of customer trends in the form of digital charts and graphs.
b) Helps in marketing campaigns
When customer trends are identified, it is helpful in figuring out how you can attract and retain customers. Product usage data is valuable in understanding the psychology of the customers, thereby proving to be essential in developing marketing strategies.
c) Defines customers' characteristics
Product usage data gives you an in-depth insight into customer specifications and attributes. It gives you their way of using your products and their pattern of behavior. Moreover, this data is helpful in formulating cohorts for further analysis.
d) Identifies the challenges faced by the customers
Product usage data gives you a well-defined idea of where your customers are struggling with your products or services. This point of struggle would be the leading cause of churn rate or low conversion rate.
This acts as a de-motivating factor that stops the customers from experiencing the value of your product. In addition, this hinders your process of revenue generation.
Here is where product usage data plays an inherent role in identifying those challenges, thereby enabling you to take corrective actions. This paves the way for improving your user interface and experience, overall focusing on product development.
Conclusion
Product usage data gives you meaningful insight into how your products or services are being used. This enables measurement of your product performance and gives you an understanding from the user end.
Understanding customer behavior is essential for retaining customers, which is the key to your business development.
Customer satisfaction is what companies aim at to achieve long-term survival in this competitive field of business.
Tracking the right product usage metric depending on your area of business is vital for the key functioning of your business.
In conclusion, these valuable data and insights are inherent for your business in areas of analysis, performance, development, and decision-making.
ReplayBird - Driving Revenue and Growth through Actionable Product Insights
ReplayBird is a digital experience analytics platform that offers a comprehensive real-time insights which goes beyond the limitations of traditional web analytics with features such as product analytics, session replay, error analysis, funnel, and path analysis.
With Replaybird, you can capture a complete picture of user behavior, understand their pain points, and improve the overall end-user experience. Session replay feature allows you to watch user sessions in real-time, so you can understand their actions, identify issues and quickly take corrective actions. Error analysis feature helps you identify and resolve javascript errors as they occur, minimizing the negative impact on user experience.
With product analytics feature, you can get deeper insights into how users are interacting with your product and identify opportunities to improve. Drive understanding, action, and trust, leading to improved customer experiences and driving business revenue growth.
Try ReplayBird 14-days free trial
Further Readings:
 Afra
Afra Afra
Afra Velantina