
Cohort analysis is a powerful tool that can help businesses gain a comprehensive understanding of their customers. By tracking customer activity over a longer period of time, businesses can uncover trends that are not visible when analyzing customers on a one-time basis.
With cohort analysis, businesses can gain valuable insights into customer behavior and preferences, which can be used to improve customer engagement, optimize marketing strategies, and boost customer retention.
By analyzing customer segments based on the time period when they first converted, businesses can uncover patterns in customer behavior that reveal how customer journeys are progressing.
By understanding these patterns, businesses can create more tailored experiences for customers, create more effective marketing campaigns, and optimize customer retention strategies.
Additionally, cohort analysis can provide businesses with an understanding of the effectiveness of their marketing efforts, as well as the success of their customer retention initiatives.
This blog post will explore the benefits of cohort analysis, discussing the various ways in which businesses can use it to gain valuable insights into their
- What is Cohort Analysis?
- Why is Cohort Analysis important?
- Cohort data
- Steps to perform cohort analysis
- Benefits of cohort analysis
- Areas where Cohort Analysis is used
- Cohort Analysis and Customer Retention Rate
What is Cohort Analysis?
Cohort analysis is a behavioral analysis that takes data from an e-commerce platform for the same purpose; it breaks down the user population into related groups, otherwise called cohorts, for analysis.
These groups share common characteristics and hold a defined time period. In simple words, cohort analysis is a user engagement tool over a span of time. Since this analysis deals with the breakdown of groups, it helps separate the factor of user engagement and growth metrics.
It is a valuable tool in determining whether user engagement is actually improving or if growth is playing a role.
Why is Cohort Analysis important?
Cohort analysis helps you to determine user engagement over time. Thereby, this leads to product-led growth.
Moreover, it depicts how users in different groups behave with regard to your product/service. It gives you meaningful insight since it separates user engagement and the growth metric.
From this, you can determine the actual behavior of the users. Furthermore, cohort analysis helps you to determine the actions you must take from its valuable insights.
It differentiates the various types of users in your platform which, helps you to know the actual user behavior, their corresponding responses, and user engagement.
Example
Let us consider an example of Alpha Ltd., which is a gaming platform. Here, they have divided the related groups of users in the following manner:
- Cohort A - Users who use the application and play the game every day
- Cohort B - Users who use the application a few times a week.
- Cohort C - Users who use the application once a month.
- Cohort D - Users who use the application rarely.
- Cohort E - Users who have made in-app purchases and subscribed to ad-free services. They are users who have added value to the business by making a payment, thereby contributing to revenue generation.
This segregation of cohorts helps the company to know the actual user requirements, which helps them to tune their strategies to each group. It gives an understanding of user behavior which helps the company to provide them with suitable services.
The company tracks user engagement and helps the company to develop strategies for user experience, user engagement, and increasing revenue accordingly.
Cohort data
We know that cohort analysis is based on the related groups that we divide in order to perform an analysis. Hence, it is important to know the ways in which we can segregate these groups. Let's use what they are:
#1 Acquisition Cohorts
Acquisition Cohorts focuses on the factor of how you acquired your users. It generally focuses on the time factor of the user activity in your application. It could be on how quickly you acquired your users through various marketing strategies, i.e., the users who responded to your acquisition strategies.
Moreover, you can segregate your users based on their engagement in your application with regard to time period, i.e., daily, weekly or monthly cohorts.
In addition, you can measure the retention of the customers you have acquired to see how long your customers use your application.
#2 Behavioral Cohorts
This type of segregation is completely based on user activity or user behavior. Various actions that users can perform in your application are as follows:
- Installing your application
- Subscribing to your business
- Time spent on your application
- User activity
- Completing transactions
- Uninstalling your application
Users can perform a combination of these events over a time period. This type of segregation helps you to monitor user engagement effectively.
Steps to perform cohort analysis
Let us have a look at how we can perform cohort analysis:
-
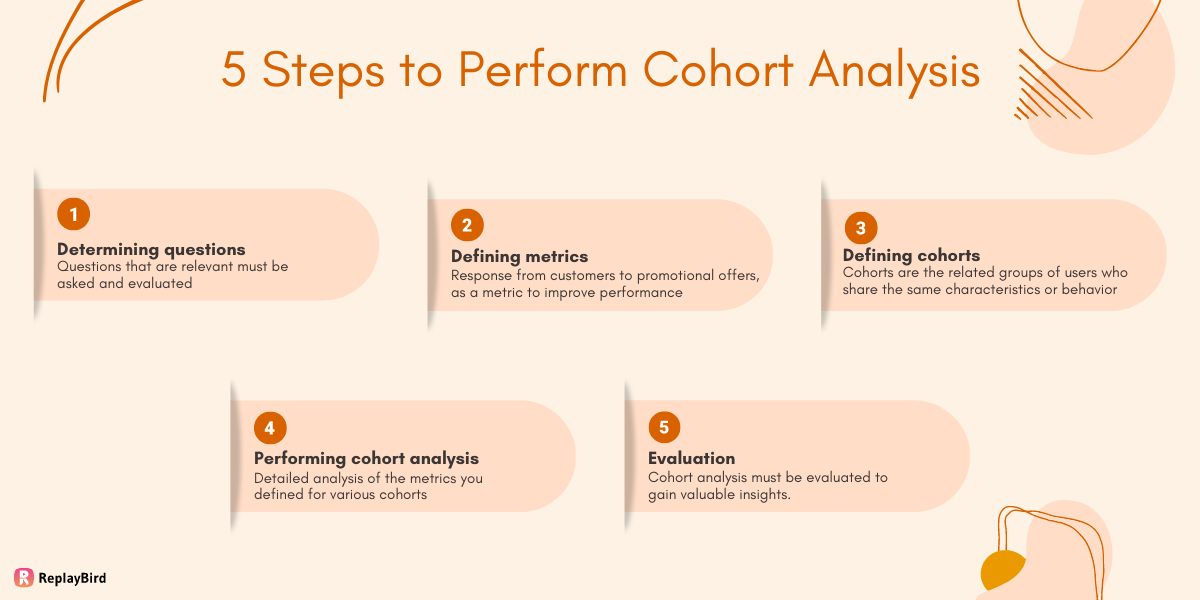
Determining questions - Cohort analysis requires a structure since the structure enables the provision of information that is necessary to improve the product or services being offered by your company. Questions that are relevant must be asked and evaluated. For instance, user engagement duration could be a topic on which questions could be determined for an OTT platform.
-
Defining metrics - Secondly, the metrics on which the data needs to be evaluated must be defined. Some of the metrics are user engagement, user activity, customer retention rate, etc. For instance, the response from customers to promotional offers could be used as a metric to improve performance.
-
Defining cohorts - Cohorts are the related groups of users who share the same characteristics or behavior. You must segregate the users based on related characteristics using the defined metrics. For instance, one cohort could be active users, and the other could be inactive users.
-
Performing cohort analysis - Data visualization is used to perform cohort analysis wherein different colors are used to differentiate between cohorts. This provides a detailed analysis of the key analytics you defined for various cohorts. This leads to the provision of specialized services to users through a better understanding of their behavior.
-
Evaluation - Finally, the test results from the cohort analysis must be evaluated to gain valuable insights. Suitable strategies could be formulated based on the results. Moreover, relevant metrics could be identified to improve your business performance.
Benefits of cohort analysis
- Compares variables - Cohort analysis helps you to compare the various metrics you have in hand based on the related groups you have descended. This paves the way for enhancing your business strategies.
- Studies customer behavior - Cohort analysis studies the user activity or behavior in your platform. It describes how cohorts are engaged in your platform. Moreover, it studies the traffic on your website, user engagement, and details on user transactions.
- Gives results on campaigns - Customer acquisition and retention can be analyzed through cohort analysis. The responses to the marketing efforts and business strategies employed can be analyzed through cohort analysis. This gives you a measure of performance and rate of success of such campaigns or efforts.
- Helps in developing strategies - The result of cohort analysis gives you meaningful insight into how to rightly treat your cohorts. It helps you in developing specialized strategies for the types of cohorts you have since each category of cohort holds different characteristics, and customized services to them are the key to improving your performance.
- Customer retention - Organizations use cohort analysis to improve their customer retention rate since it separates the user engagement and growth factors, thereby providing valuable insight. It helps in the analysis of different demographics, and psychographics which can enable the company to determine targeted strategies in order to improve the customer retention rate.
Areas where Cohort Analysis is used
Following are the areas where cohort analysis is used
- Mobile application software
- Websites
- e-commerce platforms
- Gaming platforms
- OTT platforms
- Subscription-based business
- Digital marketing
Cohort Analysis and Customer Retention Rate
Customer retention rate refers to the percentage of customers who remain customers after a specified time period. It gives your company an idea about what keeps the customers interested in your business.
Now how is it linked to cohort analysis?
Companies use cohort analysis to analyze and improve the customer retention rate since this analysis gives meaningful insight into user engagement.
Let us look at how the customer retention rate can be calculated:
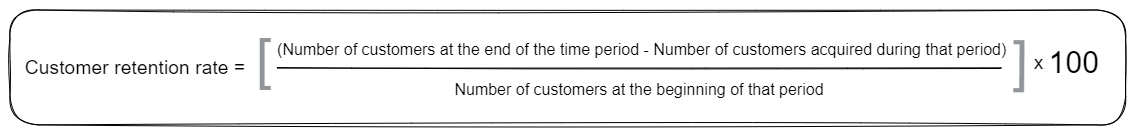
Customer retention rate gives an insight into the loyalty of the users. It helps you to see the results of your efforts and, in addition, helps you to determine better strategies to improve performance.
Key metrics for customer retention
Cohort analysis helps you to differentiate the important metrics that add value to your decisions. The metrics that help to differentiate the cohorts are as follows:-
-
Orders per customer - It refers to the number of orders placed by each customer. An increased rate of orders per customer signifies a strong retention rate for your product/service.
-
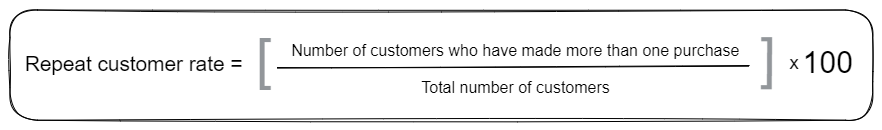
Repeat rate - It refers to the rate of customers who engage with the business in a repeated manner in the following ways:
- Interaction with the business
- Purchase of products/services
- Completing transactions
These customers are compared with other customers who terminate their relationship with your business after a single interaction. It is calculated by,
-
Time between orders - This metric calculates the average duration between the orders placed. This metric can guide the company to send customized messages or emails to retain customers. For example, sending a push notification saying "We miss you!", "We have got special offers only for you!".
-
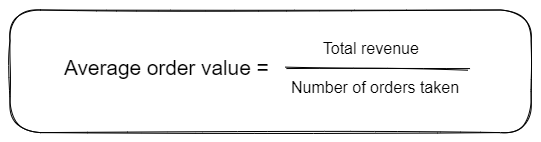
Average order value – This metric helps to denote the loyal customers who have added more value to your business. It measures the average amount spent each time a customer places an order on your website or application. It is calculated by,
Scenario
We learned that cohort analysis could study user engagement, customer acquisition, and retention rate. Now let us consider a scenario based on the above metrics. An e-commerce company notices a decline in its revenue after the third week of customer acquisition.
Hence, the company tries to re-engage its customers using personalized coupons so as to improve the retention rate. They also employed remarketing strategies such as e-mail campaigns, special offers and discounts, and advertisements for their products.
They also customized the advertisements for cohorts based on the previous purchases made during their initial engagement. This enabled the company to increase the conversion rate and retention rate over time using specialized efforts based on the various characteristics or behavior of the cohorts.
Conclusion
Cohort analysis gives an in-depth insight into the specifics of user engagement. It helps your company to improve the customer retention rate through the specified and detailed views of cohorts.
It helps to separate user engagement and the growth rate, thereby giving a clear view of customer activity or behavior. Overall, cohort analysis is a valuable tool that provides a critical view of visitor behavior analysis, which paves the way for measuring performance and developing business strategies.
ReplayBird - Driving Revenue and Growth through Actionable Product Insights
ReplayBird is a digital experience analytics platform that offers a comprehensive real-time insights which goes beyond the limitations of traditional web analytics with features such as product analytics, session replay, error analysis, funnel, and path analysis.
With Replaybird, you can capture a complete picture of user behavior, understand their pain points, and improve the overall end-user experience. Session replay feature allows you to watch user sessions in real-time, so you can understand their actions, identify issues and quickly take corrective actions. Error analysis feature helps you identify and resolve javascript errors as they occur, minimizing the negative impact on user experience.
With product analytics feature, you can get deeper insights into how users are interacting with your product and identify opportunities to improve. Drive understanding, action, and trust, leading to improved customer experiences and driving business revenue growth.