Correlation and causation both involve relationships between variables, and it is important to understand the distinction between the two in order to interpret data accurately and make logical conclusions.
While much of the time the two terms may be used interchangeably, there are important differences. Correlation is a measure of the relationship between two or more variables, while causation is a statement that one variable causes another to change.
In this blog post, we will explore the nuances between correlation and causation, and how to recognize which term applies in different situations.
- What are correlation and causation?
- Why correlation and causation?
- Difference between correlation and causation
- Correlation in statistics
- How to calculate correlation coefficient?
- Casual research
What are correlation and causation?
Before getting into the difference between correlation and causation, let us get to know their meaning in brief. Correlation is a statistical measure that describes the relationship between two variables.
This measures the strength of the relationship between two quantifiable variables. It expresses the size and direction of the relationship between variables. Its value lies between -1 to +1 on the scale of measure.
For instance, we can study the relationship between the age group and their interest in gadgets in research wherein they'll act as variables. The data analysis and interpretation after a survey would help us to get an idea of whether there's a relationship between age and interest in gadgets or not.
Now, causation denotes that the occurrence of one event is caused by the other event. That is, one event is the result of the other event. This indicates that there is a casual relationship between the two also and it explains the cause and effect phenomenon.
For example, let us consider a job and related salary wherein a high number of work hours gains you high wages in turn. This denotes that the hours you work are the cause and the effect would be the salary you receive.
The number of hours you work deliberately affects the wages you earn. This is the causation effect.
Why correlation and causation?
Correlation is a simple tool to measure relationships between variables. It proves to be important in the following ways:
- Understanding the behavior of variables
- Facilitates decision making process
- Reduces uncertainties through predictions
- Gives insights into real world relationships
Causation gives an insight into cause and effect relationships. It is important because:
- Helps understand the actions of variables
- Determines how the behavior of one variable affects another variable
- Helps in understanding the result of an event
- Answers the question of why in a relationship of variables or events
Difference between correlation and causation
Correlation specifies the relationship between two variables. The variables change together but they might or might not have a direct or indirect link between them.
Whereas causation means the result of a variable is caused by the other variable.
That is, a change in one variable causes a change in other variables. Here, the variables are correlated and also have a link between them.
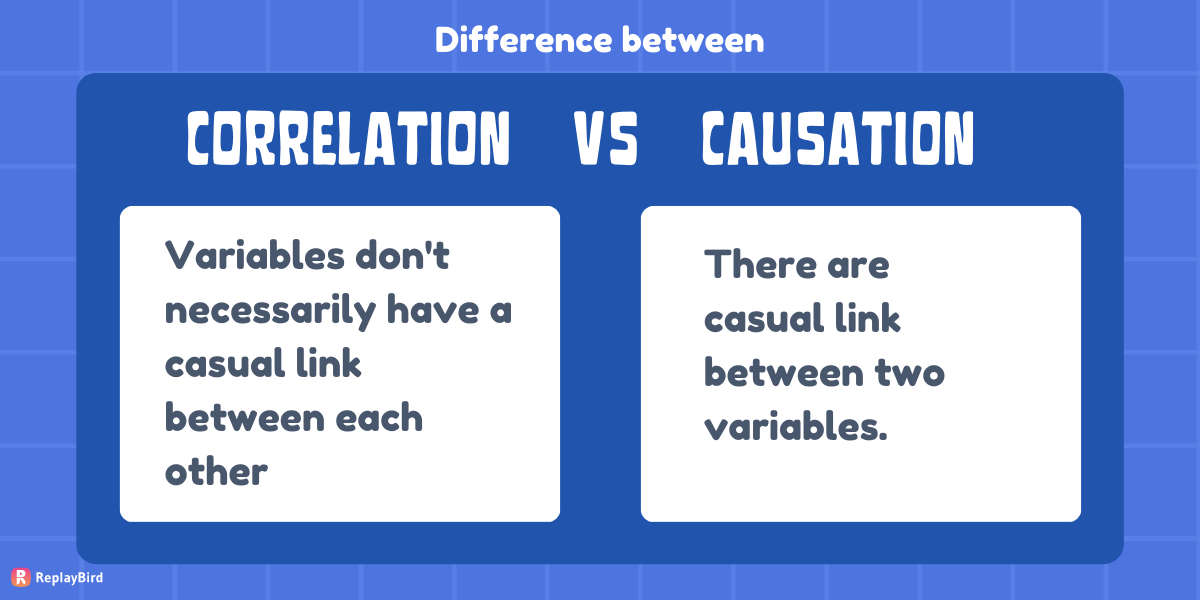
Henceforth, the key difference between correlation and causation is the existence of casual link between variables. In correlation, the variables don't necessarily have a casual link between each other whereas, in causation, there is a casual link between two variables.
From this key difference, we can understand that a correlation does not imply causation whereas causation always implies correlation.
Scenario
Let us take a business scenario to understand correlation and causation. An e-commerce company that indulges in selling herbal beauty products runs a marketing campaign to attract customers.
They hold websites and social media handles to promote their products and sell them through them.
Customers can register on their website using the "Register/Sign up" option from their website which makes them a member or registered customers.
The company conducts an analysis after its marketing campaign to see its performance and to know if they are reaching its goal.
Here, they find that as a result of the marketing campaign, many customers have registered with their brand and become a member. Moreover, the campaign has generated customer retention.
From this, we can understand that the marketing campaign has resulted in an increase in registered customers and customer retention. In simple words, the marketing campaign has caused higher membership and customer retention.
Now the company also analyses that there is a relationship between customers' membership and customer retention. It is to be noted that both these events are not the cause or effect of each other rather they are simply correlated to each other.
Correlation in statistics
Correlation is the most used approach in research since it depicts if variables have a relationship with each other or not. The single number which is summarized from the method as correlation is called as the coefficient of correlation.
It is represented by the symbol 'r' and it is measured on a scale from -1 through 0 to +1. Now, what do these measure stand for? Let's see them below:
Generally, the correlation coefficient is either positive or negative and is close to zero, depicting whether the variables have little or no relationship.
#1 Positive correlation coefficient
A coefficient correlation that is nearer to +1 indicates a positive relationship between the two variables i.e. the existence of the relationship is confirmed. This could mean that the increase in one variable is connected to the increase in the other variable.
Here, the variables are directly proportionate to each other.
From this, we can confirm that there is a positive relationship between the two variables.
For example, the more number of time a person works out, the more calories he/she would burn. Here, as the variable of time of workout increases, the variable of calories also increases. This denotes that there is a positive relationship between the two variables.
Furthermore, a positive correlation is measured from +0.1 to +1.0. For better interpretation, we need to understand the weak and strong positive correlation:
a) Weak positive correlation - When one variable increases but the other variable tends to increase but in a slow or weak manner, it is considered to be a weak positive correlation. It ranges from +0.1 to +0.3.
b) Moderate positive correlation - When one variable increases and the other variable tends to increase in a moderate manner, it is considered to be a moderate positive correlation. It ranges from +0.3 to +0.5.
c) Strong positive correlation - When one variable increases and the other variable tends to increase in a strong manner, it is considered to be a strong positive correlation. It ranges from +0.5 to +1.0.
#2 Negative correlation coefficient
A coefficient correlation which is nearer to -1 indicates a negative relationship between the two variables. This could mean that the increase in one variable is being associated to the decrease in the other variable.
Here, the variables are inversely proportionate to each other. From this, we can understand that there is a negative relationship between the two variables.
For example, the higher we climb the mountain which is an increase in height, it gets colder which is the decrease in the temperature. Here, as the variable of height increases, the variable of temperature decreases which denotes that there is a negative correlation coefficient between them.
Moreover, a negative correlation is measured from -0.1 to -1.0. For better interpretation, we need to understand the weak and strong negative correlation:
a) Weak negative correlation - When one variable increases but the other variable tends to decrease but in a slow or weak manner, it is considered to be a weak negative correlation. It ranges from -0.1 to -0.3.
b) Moderate negative correlation - When one variable increases and the other variable tends to decrease in a moderate manner, it is considered to be a moderate negative correlation. It ranges from -0.3 to -0.5.
c) Strong negative correlation - When one variable increases and the other variable tends to decrease in a strong manner, it is considered to be a strong negative correlation. It ranges from -0.5 to -1.0.
#3 Zero correlation coefficient
In statistics, when the value of correlation is zero, it denotes that there is no relationship between the two variables. It is not indicative of a linear relationship between the variables and is denoted as r=0.
For example, let us consider the variables of ice-cream sales and gender. Here, it can be seen that there's no relationship between the two, and gender doesn't have anything to do with the consumption of ice-cream.
How to calculate the correlation coefficient?
Firstly, you need to collect data in order to measure correlation for your research. Let us consider that you conduct research on workout patterns among today's generation. You want to know the relationship between the time period of the workout and the number of calories burnt.
To measure correlation, you first need to specify your hypothesis, in other words, conduct hypothesis testing:
Hypothesis testing: A hypothesis is generally referred to as an assumption. In statistics, it refers to a statement that can be tested to derive at a result.
It is a proposed assumption that is tested by various statistical tools to see if the statement is true or not. It includes:
- Null hypothesis (H0) - In statistics, the null hypothesis states that there is no significant relationship between the two variables. Researchers disprove the null hypothesis so that they can set the stage for further research.
- Alternate hypothesis (H1) - It states that there is a significant relationship between the two variables.
In the example we have taken, we can write the hypothesis as follows:-
- Null hypothesis (H0) - There is no significant relationship between the amount of time spent in workouts and the calories burnt.
- Alternate hypothesis (H1) - There is a significant relationship between the amount of time spent in workouts and the calories burnt.
Now we can perform correlation using various formulae such as:
- Pearson correlation coefficient
- Linear coefficient correlation
- Sample correlation coefficient
- Population correlation coefficient
Moreover, you have much software available for measuring correlation and conducting research with easy clicks. One such software is SPSS which stands for Statistical Package for Social Sciences.
It is a statistical software package that helps in conducting research, measuring correlation and performing various other methods of data analysis and interpretation.
For the scenario we have considered, the correlation would result in a strong positive correlation, indicating that there's a significant relationship between the amount of time spent on a workout and the calories burnt.
Result: Null hypothesis (H0) is rejected.
Casual research
Casual research is conducted through controlled experiments. The hypothesis is tested to measure causation in research. Moreover, a controlled experiment helps in eliminating the influence of the third variable, thereby establishing directionality.
Let us consider a scenario to understand this concept better.
A business conducts a marketing campaign in city A to increase its sales. Here, we have two variables - the effect of the marketing campaign and the sales factor. It can be seen that the marketing campaign is the cause and the sales/revenue is the effect.
Hypothesis testing is done to oversee the relationship between the two variables. It could be seen that there's a strong positive relationship between the two variables. The company notes that there is a 7% increase in sales in city A after the marketing campaign.
To see if marketing efforts are really the cause of an increase in sales/revenue, the company conducts a marketing campaign in another city called B. This is because other factors such as an increase in demand, etc might be a reason for increasing sales.
After a certain period, the company finds that there is a 6% increase in sales in city B. From this, they conclude that there is a cause-and-effect relationship between the marketing campaign and an increase in sales.
Conclusion
Correlation vs. Causation - The key difference between these statistical measures is the existence of a casual link between the variables involved. Causation always implies that there is a correlation between variables but correlation does not imply causation.
Overall, their differences lie in the nature of the relationship between the variables and these measures prove to be important statistical languages for the field of research.
ReplayBird - Driving Revenue and Growth through Actionable Product Insights
ReplayBird is a digital experience analytics platform that offers a comprehensive real-time insights which goes beyond the limitations of traditional web analytics with features such as product analytics, session replay, error analysis, funnel, and path analysis.
With Replaybird, you can capture a complete picture of user behavior, understand their pain points, and improve the overall end-user experience. Session replay feature allows you to watch user sessions in real-time, so you can understand their actions, identify issues and quickly take corrective actions. Error analysis feature helps you identify and resolve javascript errors as they occur, minimizing the negative impact on user experience.

With product analytics feature, you can get deeper insights into how users are interacting with your product and identify opportunities to improve. Drive understanding, action, and trust, leading to improved customer experiences and driving business revenue growth.
Try ReplayBird 14-days free trial
Further Readings:
 Uma
Uma Afra
Afra Afra
Afra