Chart.js is an open-source JavaScript library used to create interactive and visually appealing charts for the web.
It is an extremely powerful and flexible tool for displaying data in a variety of formats, and can be easily implemented in a React project to create a dynamic and engaging user experience.
The popularity of chart.js is due to its user-friendly nature and its ability to quickly render charts with minimal coding. In this blog post, we will discuss chart.js and its benefits when added to a React project.
We will also explore how to implement chart.js in React, discuss some of the pit falls of chart.js, and provide some helpful tips and tricks to make the most of chart.js within your project.
By the end of this post, you should have a better understanding of what chart.js can do for your React project, and the knowledge to successfully implement it.
- What is Chart JS in React?
- Why Chart.js?
- How can I use Chart.js in a React application?
- Components of Chart.js React
- Passing data to a Chart.js component in React
- How do I change the type of chart (e.g. from bar to line) in a Chart.js component in React?
What is Chart JS in React?
To begin with, React is a Java script-based UI library. It is library rather than a language and is primarily used for web development. This library is used for building user interfaces and modern applications.
Chart.js is a Java Script library which is used for creating charts on websites. It is one of the libraries available for creating js chart react to make it easy to use.
Moreover, chart.js supports 8 different types of responsive charts. Once you set up your chart, chart.js will do the responsive jobs and make it legible. In addition, chart.js graphs are customizable.
Why Chart.js?
Chart.js is used for the following benefits:
- Easy to use
- Best documentation facilities
- Simple visualization library
- Helps in creating flexible charts
- Well maintained library
Data visualization is an essential part of software development since it helps you to communicate better with the end users. Moreover, visualizing data helps the users to understand better.
How can I use Chart.js in a React application?
To use Chart.js in a React application, you can use the react-chartjs-2 package, which allows you to use Chart.js as a component in your React code. First, you will need to install the package using npm or yarn:
npm install react-chartjs-2 chart.jsor
yarn add react-chartjs-2 chart.jsThen, you can import the Chart component from the react-chartjs-2 package and use it in your React code like any other component. For example:
import React from 'react';
import { Line } from 'react-chartjs-2';
// Define the data for the Line chart
const data = {
// X-axis labels for each day of the week
labels: ['Monday', 'Tuesday', 'Wednesday', 'Thursday', 'Friday', 'Saturday'],
// Dataset configuration for the Line chart
datasets: [
{
// Label for the dataset
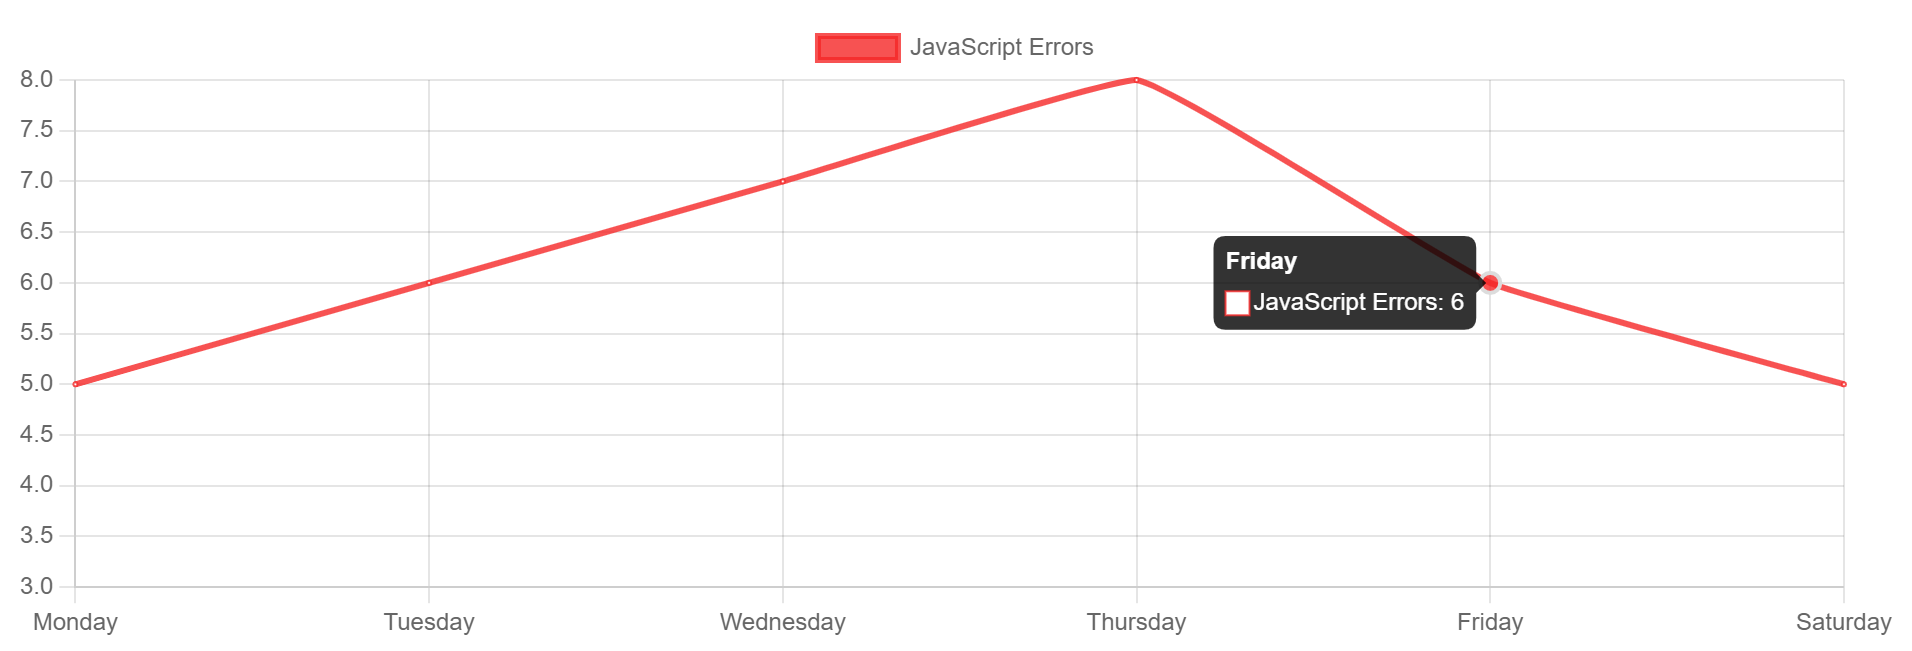
label: 'JavaScript Errors',
// Configuration for the appearance of the line
fill: false, // Do not fill the area under the line
lineTension: 0.1, // Tension of the line curve
// Styling for the line and data points
// chartjs background color
backgroundColor: 'rgba(245,39,39,0.8)',
borderColor: 'rgba(245,39,39,0.8)',
//... (other styling properties)
// Data points representing JavaScript errors for each day
data: [5, 6, 7, 8, 6, 5, 3] // The number of errors recorded for each day
}
]
};
// React functional component called 'App'
function App() {
return (
<div>
{/* Render a Line chart using the provided data */}
<Line data={data} width={75} height={25} />
</div>
);
}
// Export the 'App' component as the default export
export default App;
You can also pass options property to the Chart component to customize the appearance and behavior of the chart.
Note that you need to import chart.js library in addition to react-chartjs-2 package to use the Chart component in your React application.
Components of Chart.js React
React Chart.js offers a variety of charts to choose the following are the list of charts:
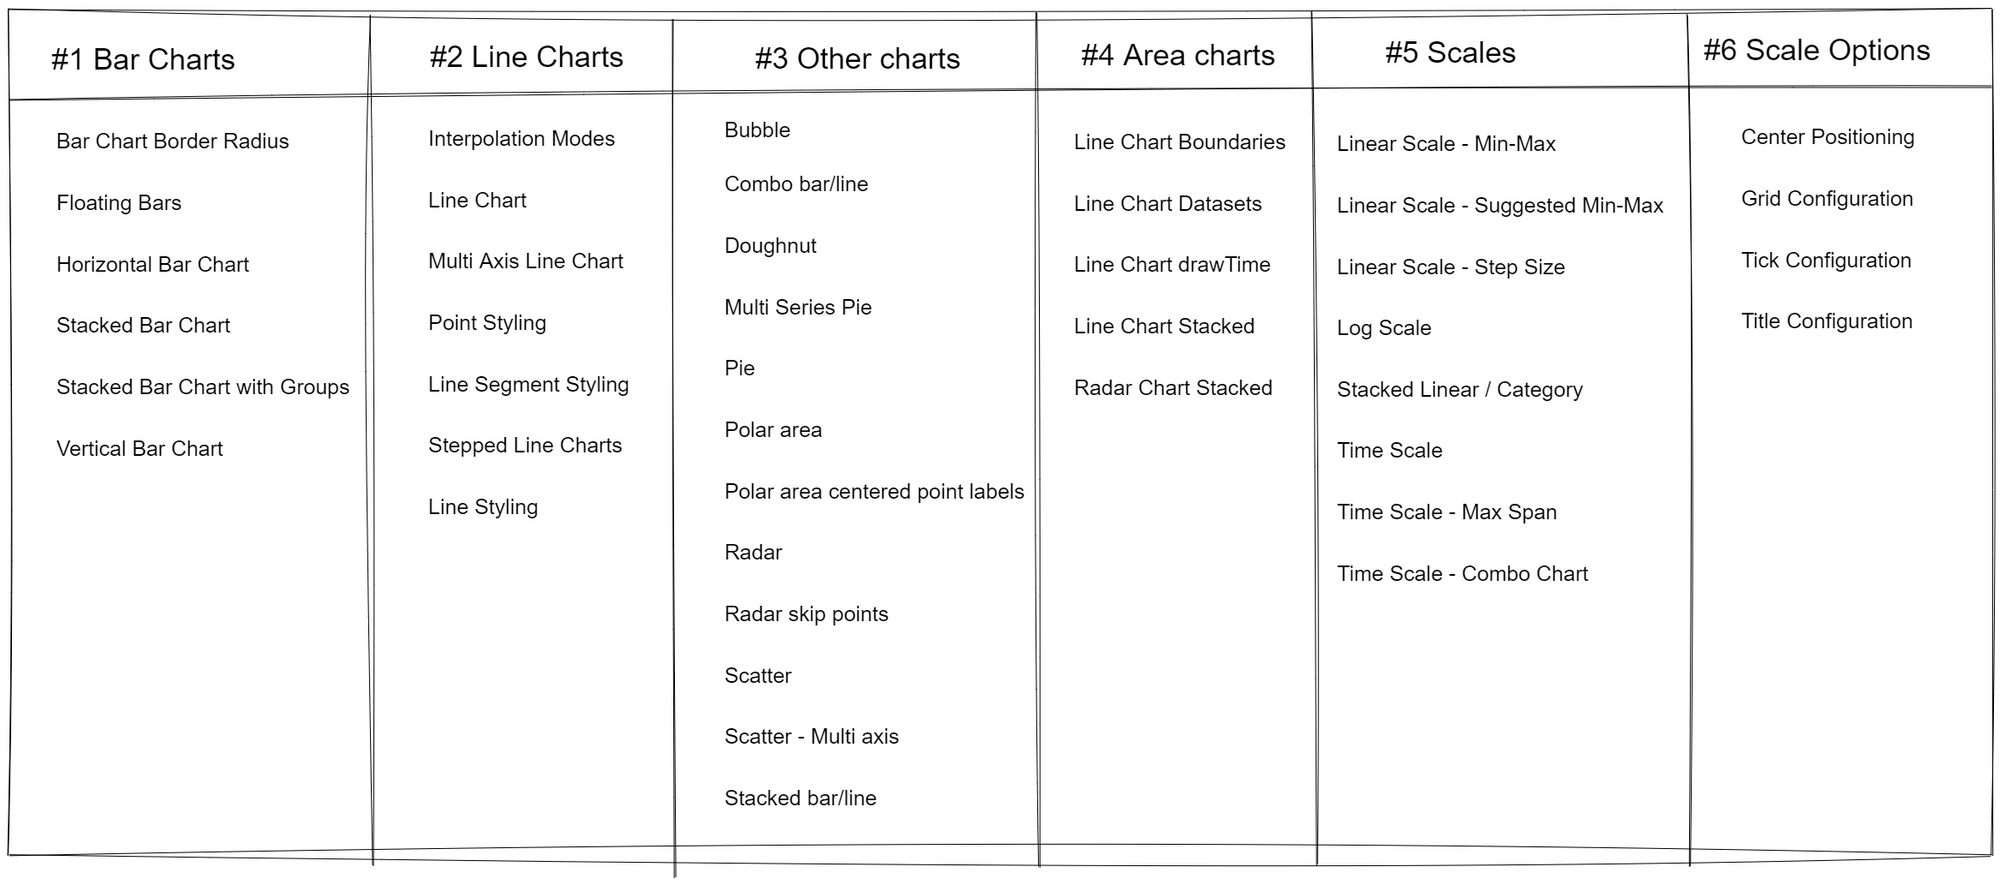
The main props being accepted by the React components are data and options. Some of the properties are chartjs background color, border Width, etc. Now we shall see some basic charts and their codes in react
Passing data to a Chart.js component in React
To pass data to a Chart.js component in a React application, you can pass a data prop to the component. The data prop should contain an object with properties for the chart's data and options.
For example, you can pass data to a Chart.js component like this:
// Importing the Bar component from the 'react-chartjs-2' library
import { Bar } from 'react-chartjs-2';

// Define a functional component named 'MyChart'
function MyChart() {
  // Data configuration for the Bar chart
  const data = {
    labels: ['Monday', 'Tuesday', 'Wednesday', 'Thursday', 'Friday', 'Saturday'],
    datasets: [
      {
        // Label for the dataset
        label: 'My First dataset',

        // Styling properties for the bars
        backgroundColor: 'rgba(255,99,132,0.2)',// chartjs background color
        borderColor: 'rgba(255,99,132,1)',
        borderWidth: 1,
        hoverBackgroundColor: 'rgba(255,99,132,0.4)',
        hoverBorderColor: 'rgba(255,99,132,1)',

        // Data values for the bars (representing some data for each day)
        data: [65, 59, 80, 81, 56, 55, 40] // The values for each day of the week
      }
    ]
  };

  // Return JSX to render the Bar chart using the 'Bar' component
  return (
    <div>
      {/* Render a Bar chart using provided data and options */}
      <Bar
        data={data} // Assign the data to be displayed in the chart
        width={100} // Set width of the chart
        height={50} // Set height of the chart
        options={{ maintainAspectRatio: false }} // Set options for the chart
      />
    </div>
  );
}
In this example, the data prop contains an object with properties for the chart's labels and datasets. The labels property contains an array of strings that will be used as the labels for the chart, and the datasets property contains an array of objects that define the data for the chart.
Each object in the datasets array should have properties for the label, chartjs background color, border color, border width, hover background color, hover border color and data.
You can also pass options property to the Chart component to customize the appearance and behavior of the chart.
How do I Change the Chart Type
To change the type of chart in a Chart.js component in a React application, you can update the options prop of the component with a new value for the type property.
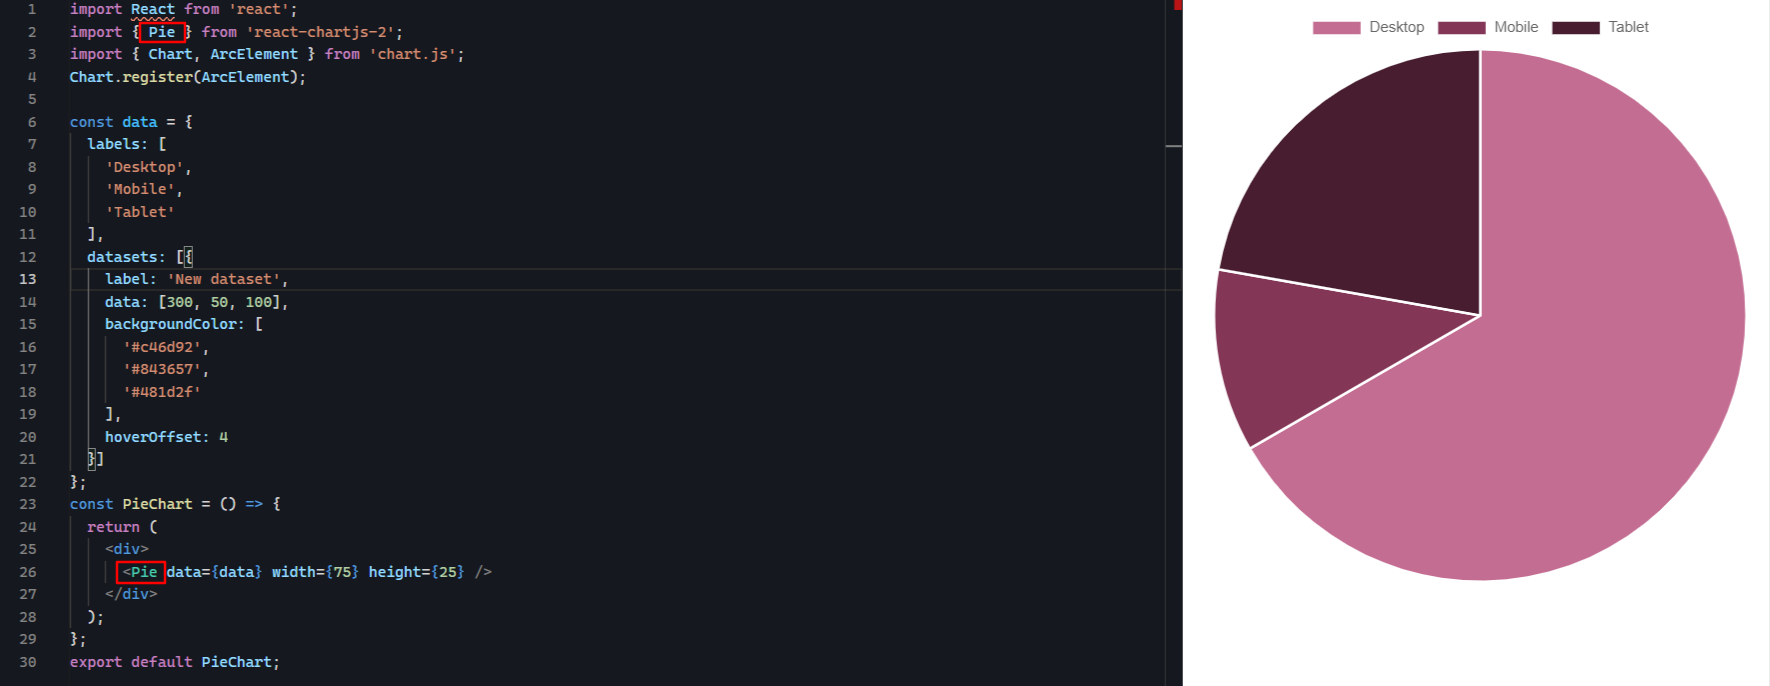
For example, if you want to change a Pie chart to a Bar chart, you can update the options prop like this:
// Importing necessary components from 'react', 'react-chartjs-2', and 'chart.js' libraries
import React from 'react';
import { Pie } from 'react-chartjs-2';
import { Chart, ArcElement } from 'chart.js';

// Registering the ArcElement for customization with Chart.js
Chart.register(ArcElement);

// Data configuration for the Pie chart
const data = {
  labels: [
    'Desktop',
    'Mobile',
    'Tablet'
  ],
  datasets: [{
    // Label for the dataset
    label: 'New dataset',

    // Data values for each section of the pie chart
    data: [300, 50, 100],

    // Colors for each section of the pie chart
    backgroundColor: [
      'rgb(250, 242, 150)',
      'rgb(150, 250, 153)',
      'rgb(150, 245, 250)'
    ],

    // Offset when hovering over sections of the pie chart
    hoverOffset: 4
  }]
};

// Functional component 'PieChart' to render the Pie chart
const PieChart = () => {
  return (
    <div>
      {/* Render a Pie chart using provided data and options */}
      <Pie data={data} width={75} height={25} />
    </div>
  );
};

// Export 'PieChart' component as the default export
export default PieChart;
You can also change the type of chart by simply changing the imported component at the top of the file. For example, if you want to use a Pie chart, you can import like this:
Before:
import { Pie } from 'react-chartjs-2';To:
import { Bar } from 'react-chartjs-2';also don't forget this part in your JSX as well.
Before:
<Pie data={data} />To:
<Bar data={data} />Before:
After:
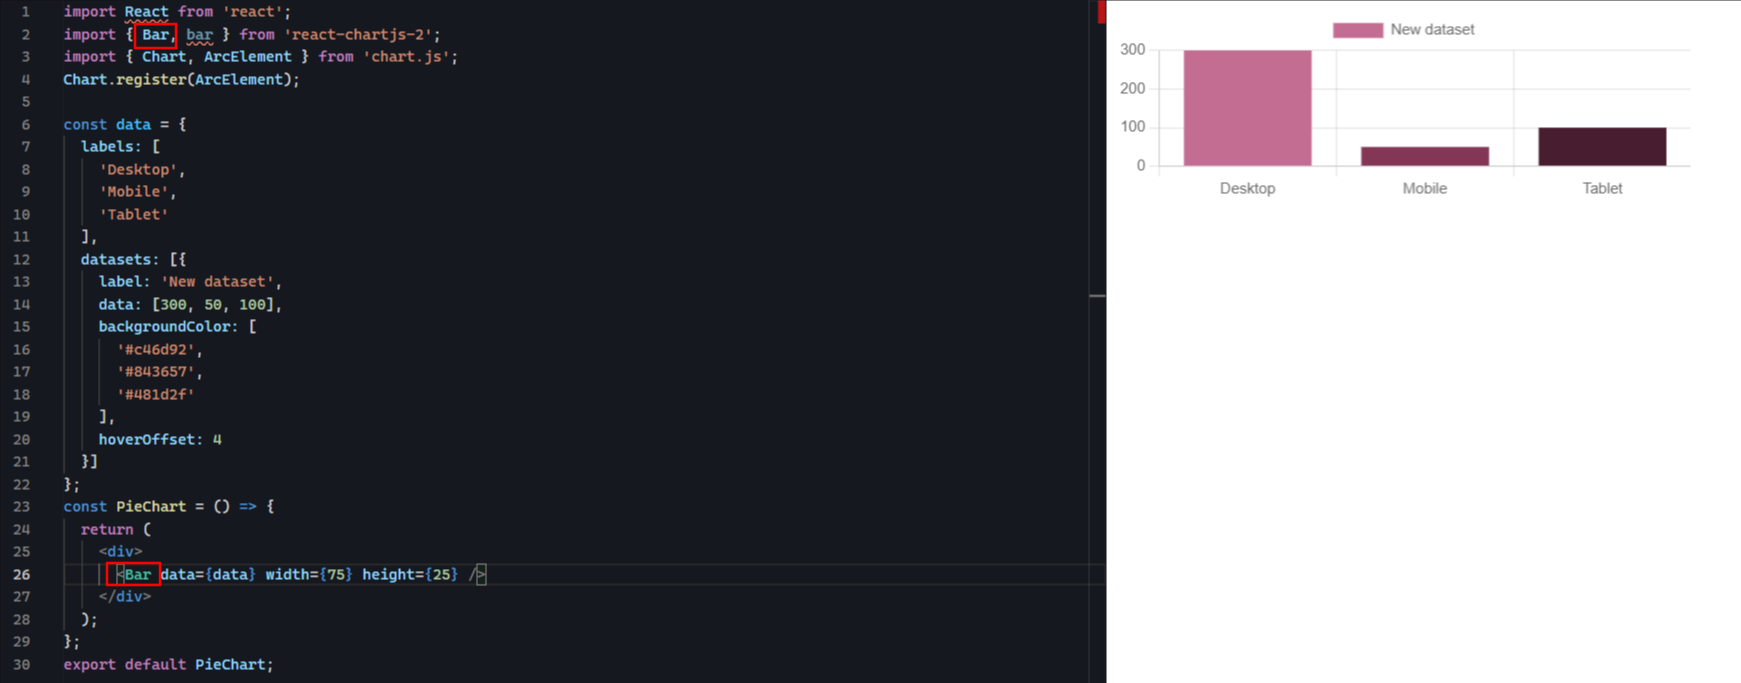
You can change the type of chart by replacing the component imported from the react-chartjs-2 package with any other js chart react type, such as Line, Radar, Polar, etc.., that only comes under chart-js
Additionally, you can also use options prop to configure and customize the behavior and appearance of the chart. For example, you can use options property to change the type of chart dynamically by updating the options prop with a new value for the type property.
Other Chart.js Examples
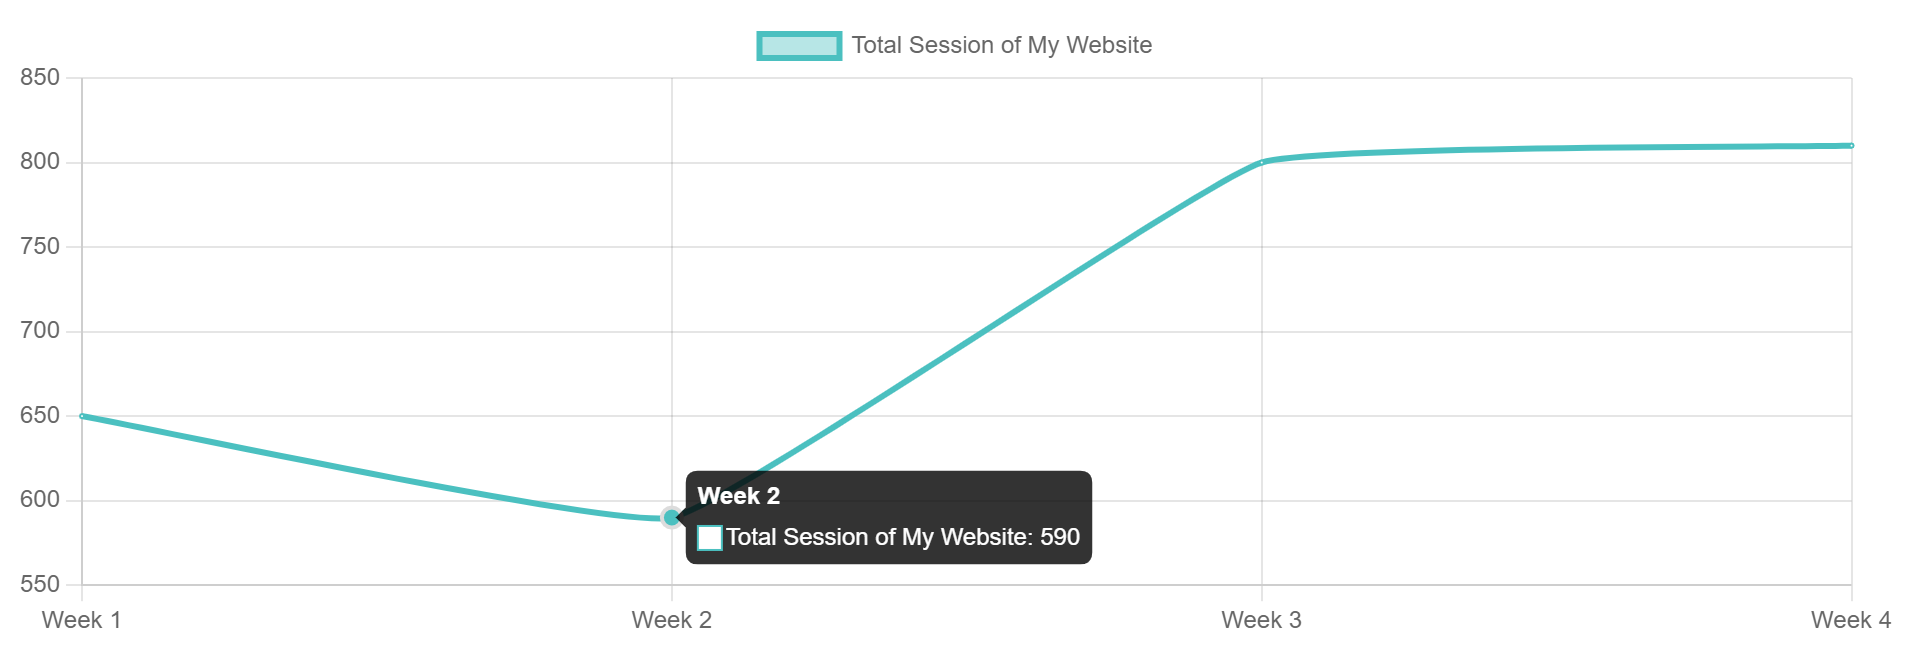
1. Line chart
Follow the below steps:
- Create new folder called Components.
- Create a new filled called Linechart.js and add the below code:
Code:
// Importing necessary components from 'react' and 'react-chartjs-2' libraries
import React from 'react';
import { Line } from 'react-chartjs-2';

// Data configuration for the Line chart
const data = {
  labels: ['Week 1', 'Week 2', 'Week 3', 'Week 4'], // X-axis labels representing weeks
  datasets: [
    {
      // Label for the dataset
      label: 'Total Session of My Website',

      // Configuration for the appearance of the line
      fill: false, // Do not fill the area under the line
      lineTension: 0.1, // Tension of the line curve

      // Styling for the line and data points
      backgroundColor: 'rgba(75,192,192,0.4)', // Background color for the line area
      borderColor: 'rgba(75,192,192,1)', // Border color for the line
      //... (other styling properties for points and hover effects)

      // Data values representing total sessions for each week
      data: [650, 590, 800, 810], // Total session values for the four weeks
    },
  ],
};

// React functional component 'App' to render the Line chart
function App() {
  return (
    <div>
      {/* Render a Line chart using provided data and options */}
      <Line data={data} width={75} height={25} />
    </div>
  );
}

// Export 'App' component as the default export
export default App;
Output:
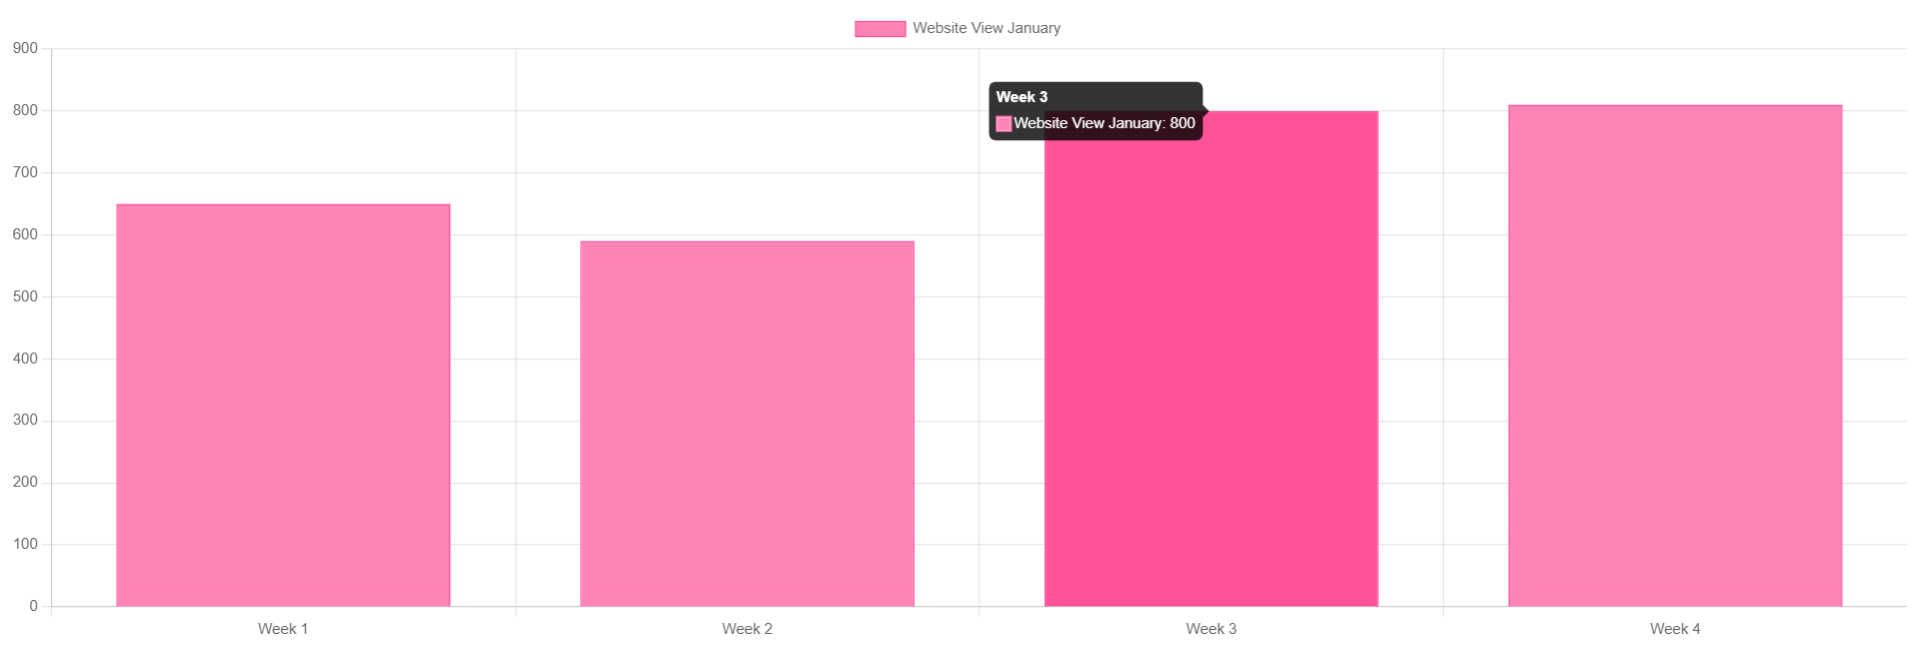
2. Bar chart
Code:
// Importing necessary components from 'react-chartjs-2' and 'chart.js' libraries
import { Bar } from 'react-chartjs-2';
import { Chart, registerables } from 'chart.js';
import React from 'react';

// Functional component 'MyChart' to render the Bar chart
function MyChart() {
  // Registering necessary Chart.js components using the registerables array
  Chart.register(...registerables);

  // Data configuration for the Bar chart
  const data = {
    labels: [
      'Week 1',
      'Week 2',
      'Week 3',
      'Week 4',
    ],
    datasets: [
      {
        // Label for the dataset
        label: 'Website View January',

        // Styling properties for the bars
        backgroundColor: '#ff84b5', // Background color for the bars
        borderColor: '#ff5197', // Border color for the bars
        borderWidth: 1, // Border width for the bars
        hoverBackgroundColor: '#ff5197', // Background color on hover
        hoverBorderColor: '#ff5197', // Border color on hover

        // Data values representing website views for each week
        data: [650, 590, 800, 810], // Website view values for the four weeks
      },
    ],
  };

  // Return JSX to render the Bar chart using the 'Bar' component
  return (
    <div>
      {/* Render a Bar chart using provided data and options */}
      <Bar data={data} width={75} height={25} />
    </div>
  );
}

// Export 'MyChart' component as the default export
export default MyChart;
Output:
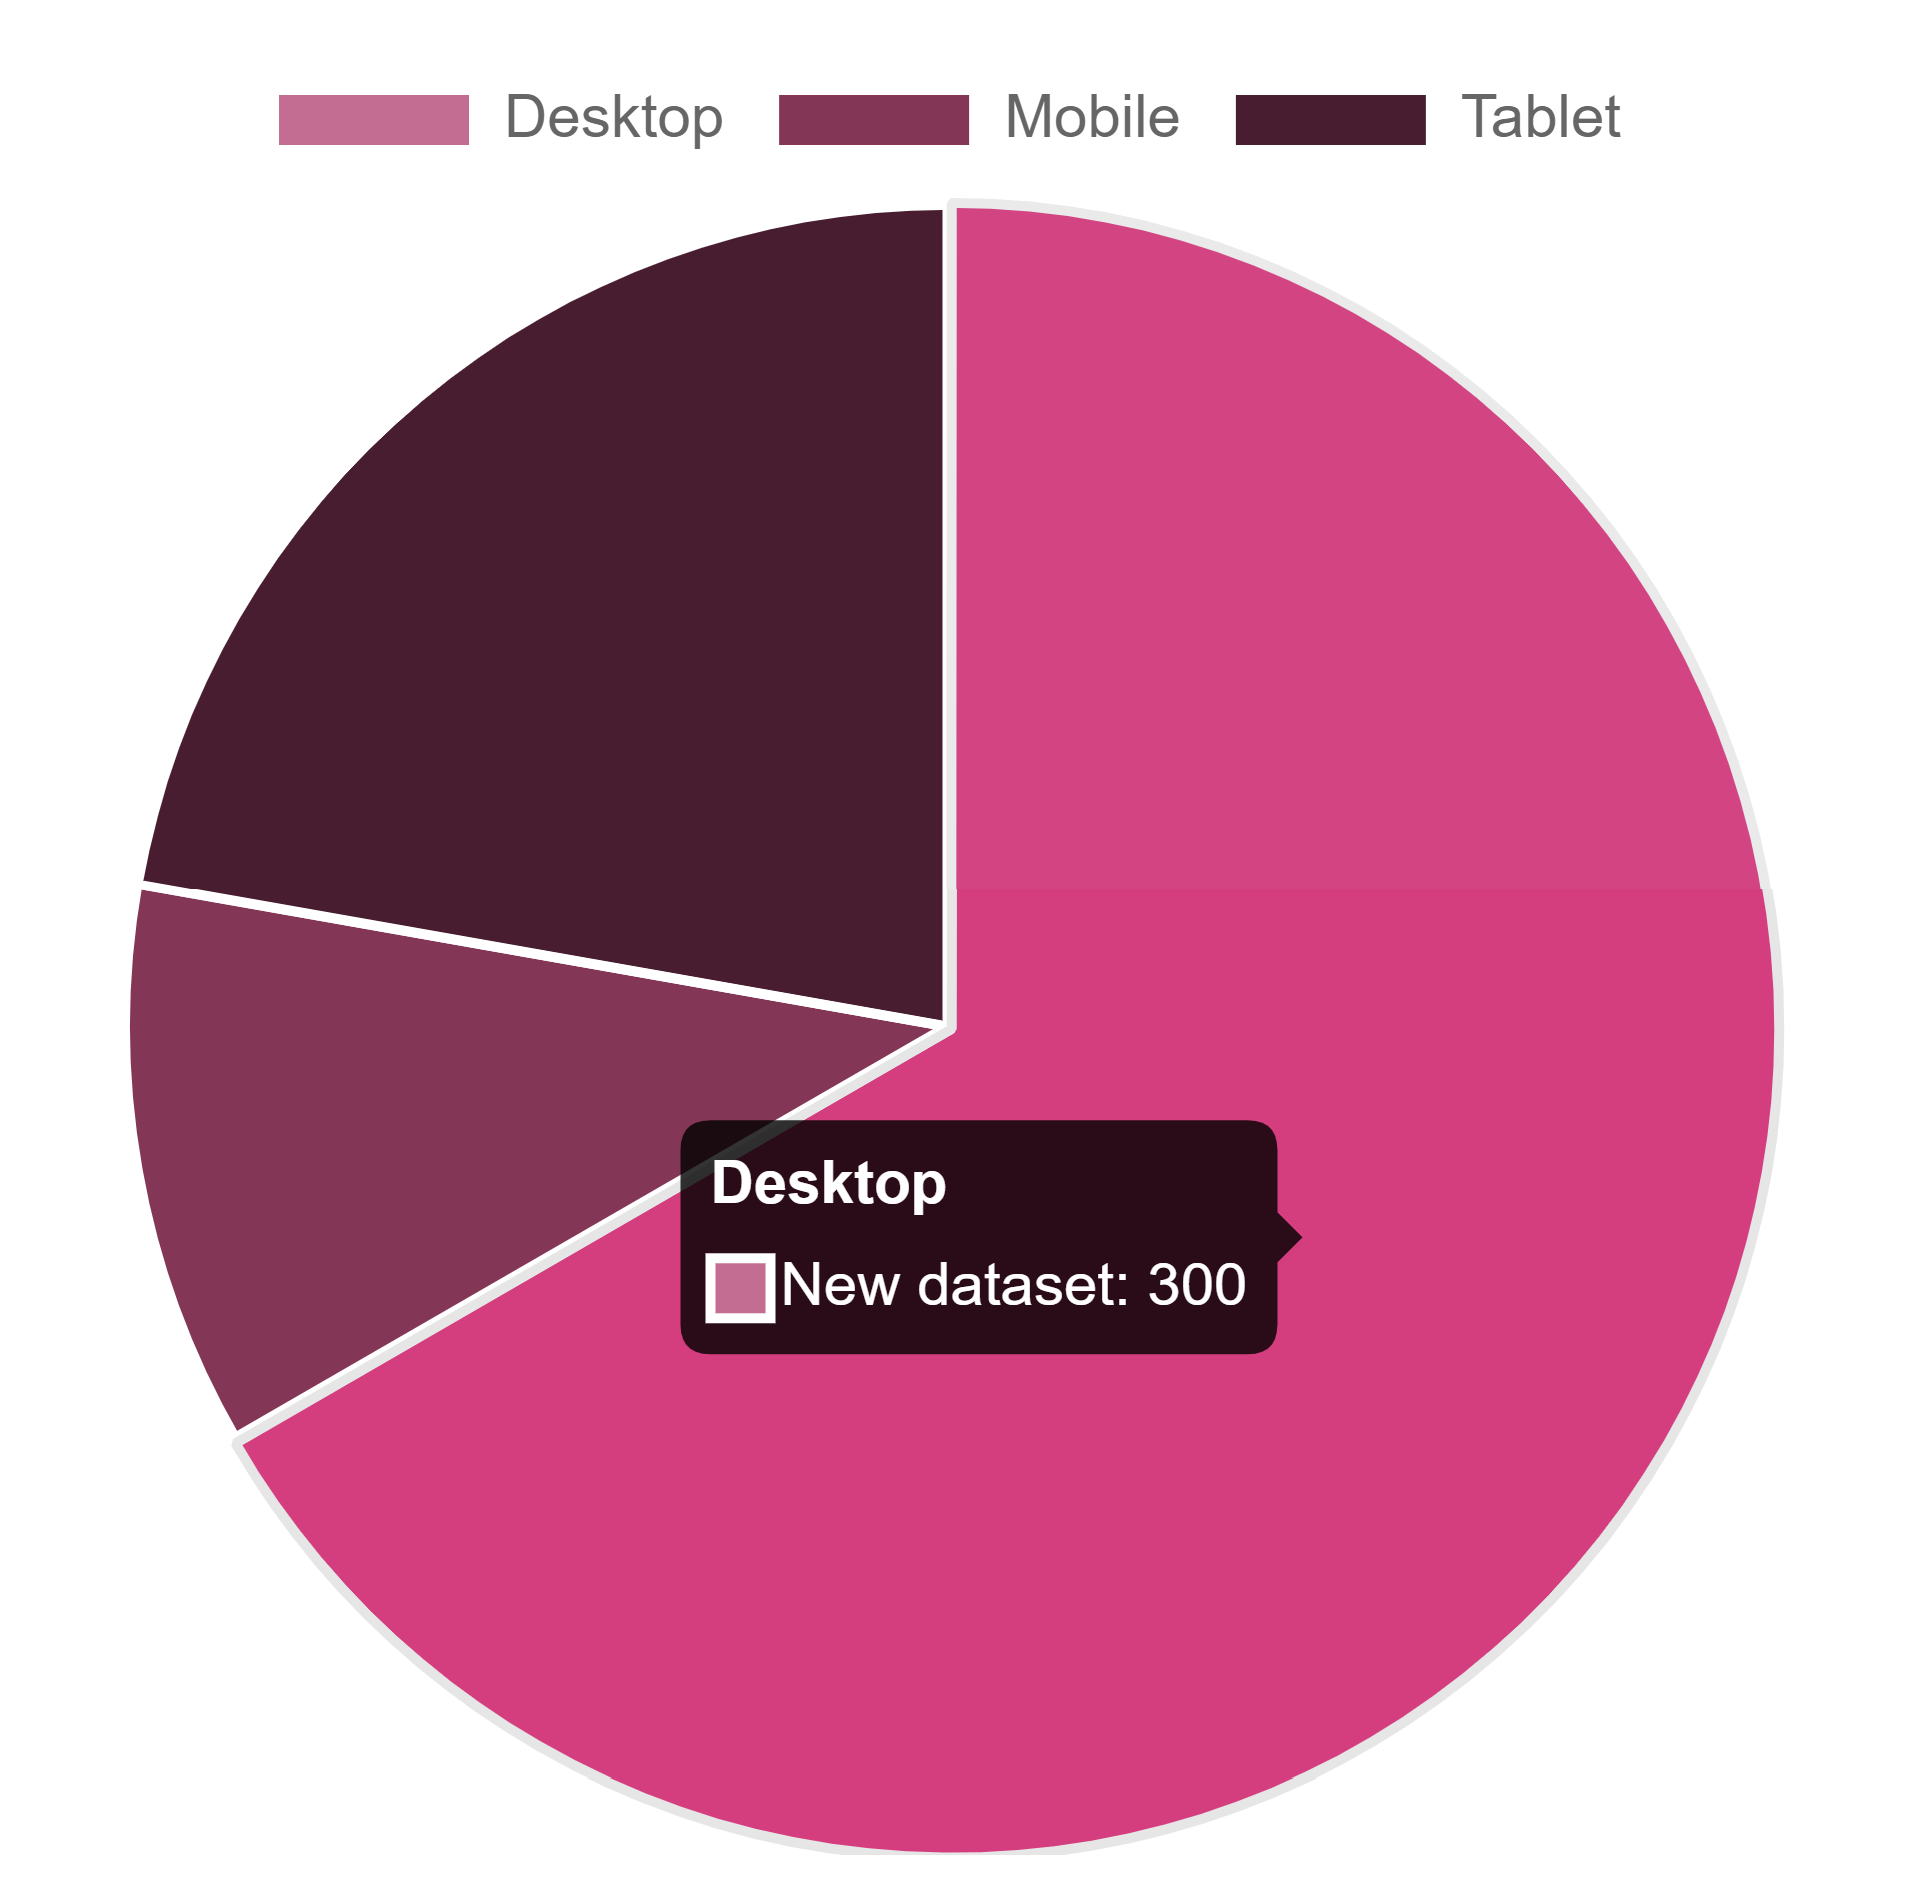
3. Pie Chart
Code:
// Importing necessary components from 'react', 'react-chartjs-2', and 'chart.js' libraries
import React from 'react';
import { Pie } from 'react-chartjs-2';
import { Chart, ArcElement } from 'chart.js';

// Registering the ArcElement for customization with Chart.js
Chart.register(ArcElement);

// Data configuration for the Pie chart
const data = {
  labels: [
    'Desktop',
    'Mobile',
    'Tablet'
  ],
  datasets: [{
    // Label for the dataset
    label: 'New dataset',

    // Data values for each section of the pie chart
    data: [300, 50, 100],

    // Background colors for each section of the pie chart
    backgroundColor: [
      '#c46d92',
      '#843657',
      '#481d2f'
    ],

    // Offset when hovering over sections of the pie chart
    hoverOffset: 4
  }]
};

// Functional component 'PieChart' to render the Pie chart
const PieChart = () => {
  return (
    <div>
      {/* Render a Pie chart using provided data and options */}
      <Pie data={data} width={75} height={25} />
    </div>
  );
};

// Export 'PieChart' component as the default export
export default PieChart;
Output:
Importing components
The final step is to import these components in to App.js file. The code for it is as follows:
// Importing components for different types of charts from their respective files
import BarChart from "./components/BarChart"; // Assuming this file contains the BarChart component
import LineChart from "./components/LineChart"; // Assuming this file contains the LineChart component
import PieChart from "./components/PieChart"; // Assuming this file contains the PieChart component

// Main App component that renders different chart components
function App() {
  return (
    <div>
      {/* Render LineChart component */}
      <LineChart />

      {/* Render BarChart component */}
      <BarChart />

      {/* Render PieChart component */}
      <PieChart />
    </div>
  );
}

// Export 'App' component as the default export
export default App;
Conclusion
Chart.js is a free and open-source JavaScript library for creating responsive and customizable charts. It offers various chart types, including line, bar, pie, doughnut, and more. Chart.js is easy to use and provides a flexible API for customizing charts to fit your needs.
Create variety of js charts react in your next web applications with Chart.js and react which helps in data visualization in software development.
ReplayBird - Driving Revenue and Growth through Actionable Product Insights
ReplayBird is a digital experience analytics platform that offers a comprehensive real-time insights which goes beyond the limitations of traditional web analytics with features such as product analytics, session replay, error analysis, funnel, and path analysis.
With Replaybird, you can capture a complete picture of user behavior, understand their pain points, and improve the overall end-user experience. Session replay feature allows you to watch user sessions in real-time, so you can understand their actions, identify issues and quickly take corrective actions. Error analysis feature helps you identify and resolve javascript errors as they occur, minimizing the negative impact on user experience.
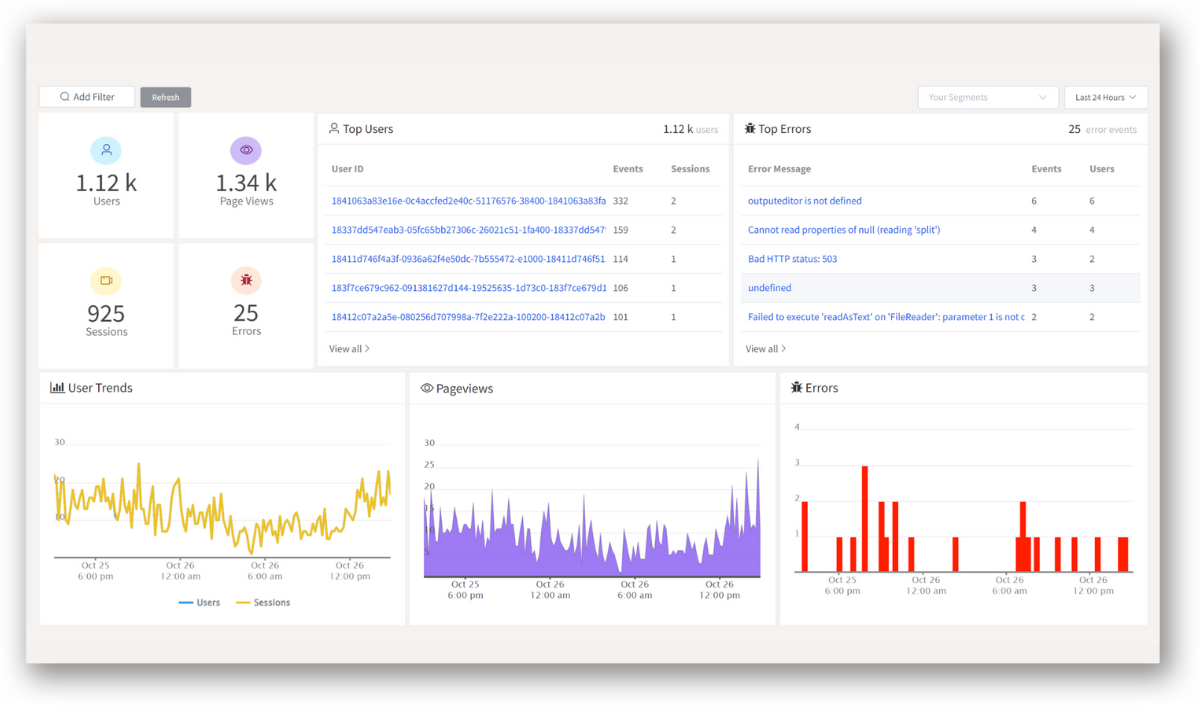
With product analytics feature, you can get deeper insights into how users are interacting with your product and identify opportunities to improve. Drive understanding, action, and trust, leading to improved customer experiences and driving business revenue growth.
Try ReplayBird 14-days free trial
Further Reading:
 Uma
Uma Uma
Uma Afra
Afra