JavaScript debugging is the process of finding errors, understanding what's wrong, and then fixing errors in your code. These JavaScript errors, also called front-end bugs, can make your web programs act weird, crash, or give wrong answers.
Debugging in JavaScript helps you figure out what's causing these errors and how to ensure proper functioning of your code.
There are many reasons why errors happen, analyzing JavaScript errors involves issues such as using word, in the wrong way, debugging in the wrong order, using the wrong type of information, calling actions in the wrong places, or having trouble with tasks that happen at different times.
JavaScript debugging is to analyze JavaScript errors and find out exactly why these are happening and how to solve them. This is important so that the code you write does what you want it to do.
Now, let's look at the steps included in JavaScript debugging:
- JavaScript Error Handling
- Effective JavaScript Debugging Techniques
- Using Error Analysis Tools to Debug JavaScript
JavaScript Error Handling
Error handling is important in JavaScript, for a reliable and flexible code. Errors can appear due to various reasons, such as incorrect data or unexpected behavior.
The try...catch statement for effective error management. Within the try block, potentially problematic code is enclosed, and if an exception is thrown, control transfers to the corresponding catch block. Here, the error parameter captures the thrown exception, allowing developers to capture specific error information.
Example: Using try...catch to Handle Division by Zero
try {
  const dividend = 10;
  const divisor = 0;
  const result = dividend / divisor;
  console.log("Result:", result);
} catch (error) {
  console.error("An error occurred:", error.message);
}
The division by zero is attempted, which would normally result in an exception being thrown. The try...catch block captures the exception, and the error message is displayed, preventing the script from crashing.
Explicit error creation is possible using the throw statement. For example, you can generate custom error types by extending the built-in Error class, for a customized error messaging and handling.
Moreover, the error stack trace, a chronological depiction of function calls leading to an error, is instrumental in debugging.
By integrating the finally block with try...catch, developers can define code that executes regardless of whether an exception occurs. This is particularly useful for resource cleanup.
Example: Using finally for Resource Cleanup
function fetchData() {
  try {
    // Simulate fetching data from a remote server
    const data = fetchDataFromServer();
    return data;
  } catch (error) {
    console.error("An error occurred:", error.message);
    return null;
  } finally {
    // Clean up resources, such as closing connections
    closeServerConnection();
  }
}
In this example, the finally block make sure that the server connection is closed, at any rate of whether an error occurred during data fetching.
Furthermore, in browser environments, global error handling can be achieved using the window.onerror event handler. It also captures unhandled errors across the application and permits actions like logging.
Effective JavaScript Debugging Techniques
This JavaScript debugging techniques results in making their applications stronger and more dependable.
For developers having good debugging skills doesn't just save time, but it also makes the whole process of creating software better and more trustworthy.
1. Console
1.1 console.log()
With console.log() function you get insights into their code's execution, which makes it easy for displaying necessary information, such as variable values, object properties, and messages, which provide a deeper understanding of program flow.
While working with JavaScript code, you can reflect the scenario where a variable username is given the value "bill_gates", with console.log(), you can now successfully print relevant details, as demonstrated in the following code snippet:
const username = "bill_gates";
console.log("Username:", username);
Here the text "Username:" and the value of the username variable are logged to the console. This let the overview of the variable's content and, consequently, helps in tracking the progression of the program.
The console.log() JavaScript debugging technique is especially beneficial when troubleshooting javascript complex systems. By strategically placing console.log() statements throughout the code, you have a deeper insight into how their program is functioning.
Let's say, throughout the development of a web application, this JavaScript debugging technique let observation of data changes, the order of operations, and any deviations from the expected behavior.
However, remember, it's really important to be careful and mindful when it comes to logging too much, this approach works best when you pick out the important parts in your JavaScript code that need attention. This way, you'll prevent your console from getting all messy and slow.
1.2 console.error()
In JavaScript debugging, the console.error() serves as a focal technique, specifically designed for addressing critical JavaScript errors within applications. This function serves as an important tool for immediately identifying and addressing JavaScript errors that have the potential to disrupt the software's functionality.
For instance, now you have a JavaScript function called calculateTotalPrice(), which takes an array of items and calculates the total price, making sure you have the right input is key to get accurate calculations. To handle this, the function we will use console.error() as shown in the code snippet below:
function calculateTotalPrice(items) {
  if (!Array.isArray(items)) {
    console.error("Invalid input: 'items' should be an array.");
    return;
  }
  // ... calculate total price ...
}
Within the code, if the items input parameter isn't an array, a major JavaScript error message is activated using console.error().
This step serves two key purposes:
- Firstly, it highlights the presence of a prioritized JavaScript error.
- Secondly, it promptly captures attention by displaying the error message in a clear red hue within the console.
This JavaScript debugging techniques proves particularly valuable in scenarios involving potentially incorrect input or conditions that might lead to unforeseen and unfavorable results.
The implementation of console.error() not only help in immediately recognizing issues at an early stage but also functions as a mechanism to notify us, prompting them to take immediate corrective measures.
1.3 console.group()
When it comes to JavaScript debugging, confronting complexity is a real challenge that can be effectively managed with the help of the console.group() and console.groupEnd() functions.
These tools are significant in maintaining a sense of order and clarity within the console output, especially in situations where numerous logs are interconnected and understanding the sequence of events is primary.
Visualize a JavaScript function named fetchData(), which is responsible for retrieving resources from a server.
In scenarios where intricate JavaScript debugging is necessary, involving multiple stages of the data-fetching process, using console.group() offers a structured and organized approach, as demonstrated in the code snippet below:
function fetchData(resource) {
  console.group(`Fetching ${resource}`);
  console.log("Initiating the fetch...");
  // ... fetch logic ...
  console.log("Fetch successful!");
  console.groupEnd();
}
In this example, console.group() is used at the beginning of the fetchData() function with a lively label implying the resource being fetched.
This starts a collapsible group in the console, letting for clear separation of the logs related to the resource's retrieval.
The logs within the group offer a step-by-step account of the process, from initiation to success.
The key advantage of using console.group() and console.groupEnd() lies in our ability to create an organized structure within the console, especially when dealing with intricate workflows or complex JavaScript debugging scenarios.
By bundling up related logs within a group, we can readily comprehend the logical flow of our code, even in situations where multiple events are occurring concurrently.
1.4 console.trace()
The sequence of function calls that lead to a specific point in your code is important for figuring out the execution path.
This is where the console.trace() function steps in as a potent asset. It provide us a stack trace, primarily a breadcrumb trail of function calls that reveals the intricate series of steps that brought you to the present moment.
Consider a scenario where a JavaScript program consists of three functions: alpha(), beta(), and gamma(). To unravel the sequence of function calls that led to the appealing of gamma(), console.trace() can be used, as shown in the code below:
function alpha() {
  beta();
}

function beta() {
  gamma();
}

function gamma() {
  console.trace("Trace from gamma:");
}

alpha();
When you run this code, the console will unfold a comprehensive trace of function calls, offering a snapshot of exactly how the program's execution unfolded and arrived at the gamma() function.
This trace acts as a guiding light, informative the journey from the initial call (alpha()) through the subsequent steps (beta() and gamma()), giving you a deeper insight into how the code behaves.
The application of console.trace() becomes particularly rewarding when you're dealing with nested or interconnected function calls.
By generating a stack trace, we can now instantly piece together the sequence of actions leading to a specific juncture. It helps pinpoint the origins of unexpected behaviors, errors, or inefficiencies hidden within the code.
JavaScript Debugging debugger Statement
The debugger statement is a built-in helper that stops the execution of JavaScript, and calls the debugger. This helps you look at the code and errors closely, like checking what values, variables have or going through your code step by step.
When you use the debugger statement in your code and your web browser's debugger tools are open, your code will stop right where you have used it. This lets you see what's going on and figure out what might be causing JavaScript errors. This is really handy for fixing issues and understanding how your code works when it's running.
function getLargestValue(array) {
  let largest = array[0];
  for (let i = 1; i < array.length; i++) {
    if (array[i] > largest) {
      debugger; // Execution will pause here
      largest = array[i];
    }
  }
  return largest;
}

const numbers = [10, 12, 58, 3, 35];
const largestNum = getLargestValue(numbers);
console.log("Largest Number:", largestNum);
When the code runs and reaches the debugger statement, it will pause execution, and your browser's developer tools will be activated (assuming they are open). This allows you to inspect variables like largest, i, and arr, as well as step through the code line by line.
In the developer tools there are a list that shows where your code is running, a part that shows what line of code is being looked at, and a place that tells you what values your variables have.
You can also check with "Step Into," "Step Over," and "Step Out." These help you move through your code one step at a time.
But remember, there's a special statement you can use in your code called "debugger." Just know that you should only use it when you're working on your code. Before you show your work to others, you need to take out or hide the debugger parts.
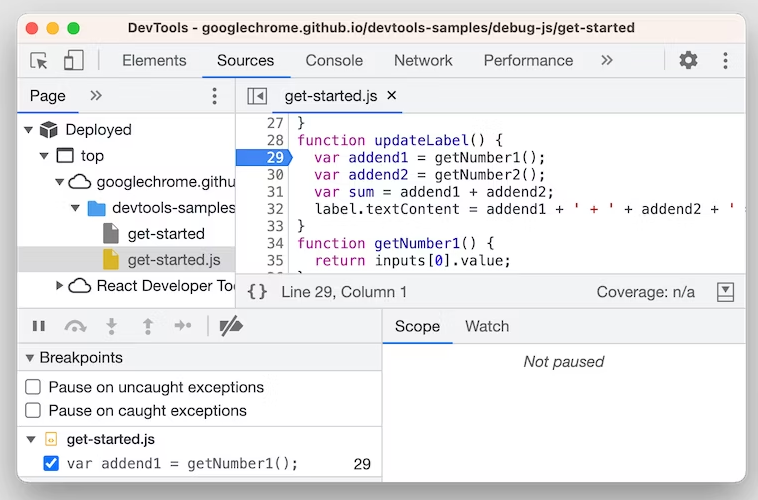
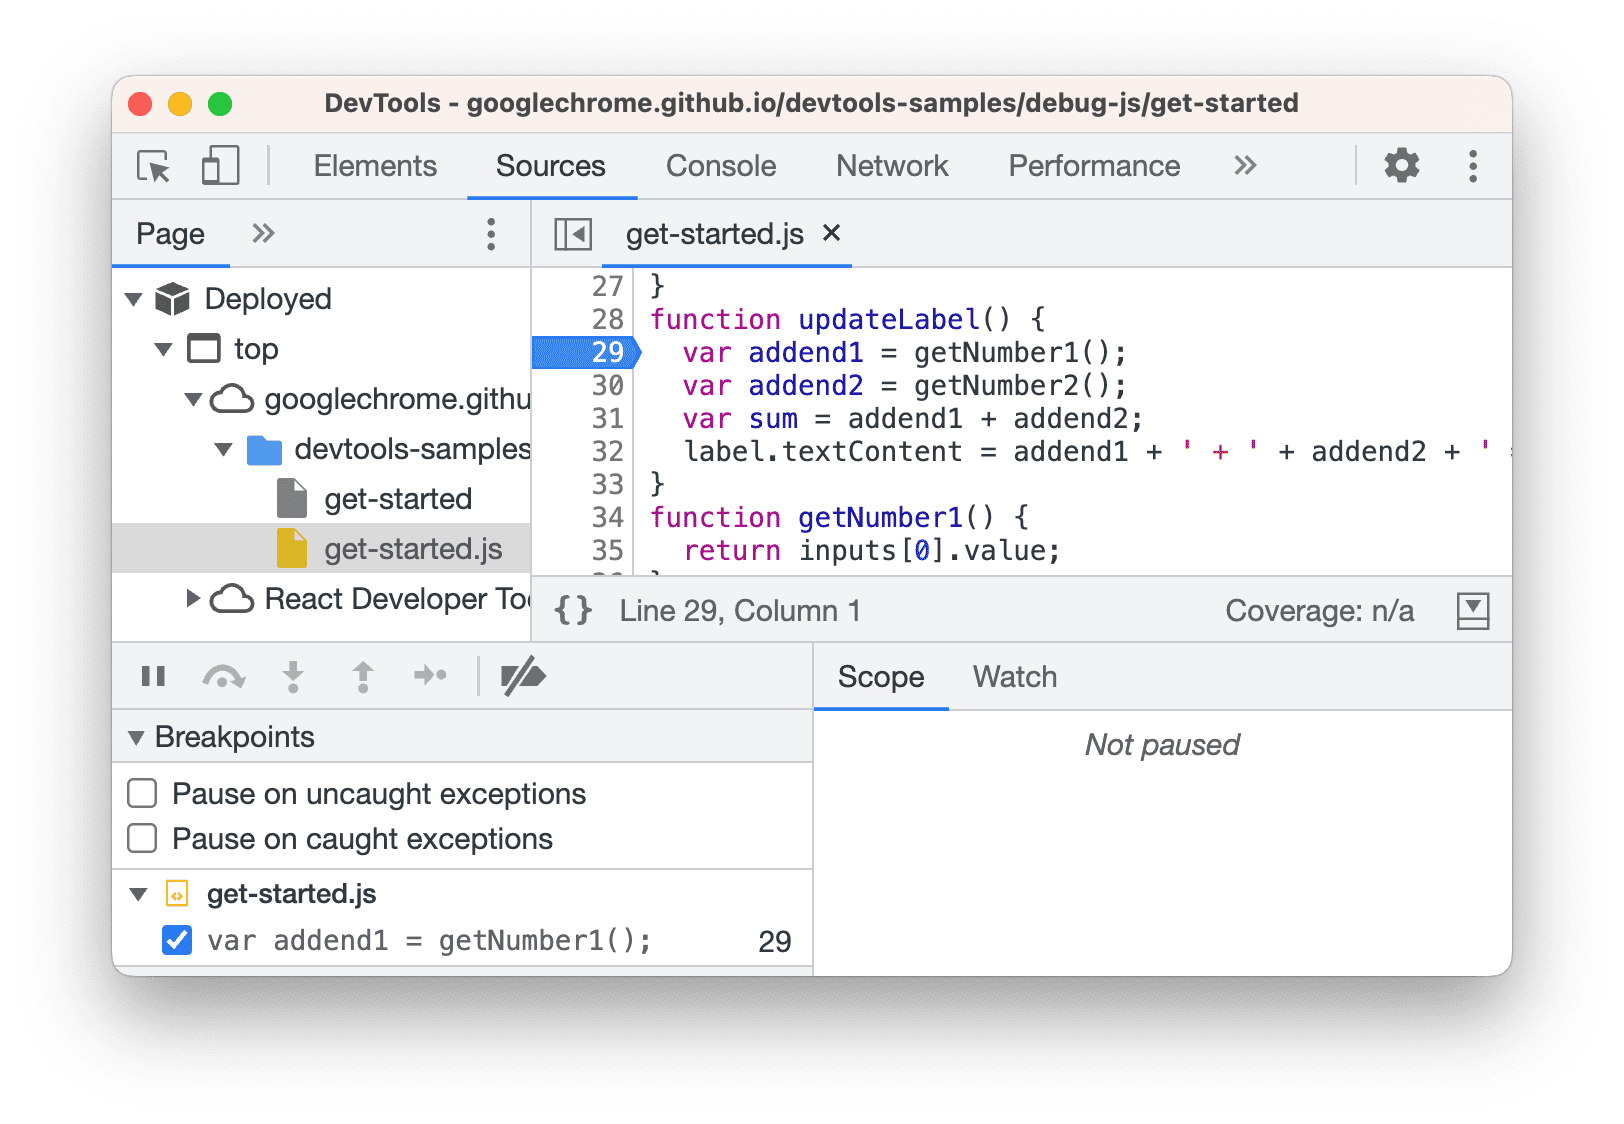
JavaScript Debugging with Browser Dev Tools
Browser DevTools let you stop your code at certain points, like pressing a pause button. This helps you look at the values, follow the code step by step, and find the errors more easily.
Here's how to do it:
- First, open DevTools (usually by right-clicking on a webpage and choosing "Inspect" or pressing F12).
- Then, go to the "Sources" tab (you'll see a list of files where your code is).
- Pick the one you want to check.
- Find the line of code where you want to stop and click on the number next to it.
- This makes a blue mark that says "stop here."
When your code is paused, you can use buttons in DevTools to move through your code step by step. One button goes to the next line, another goes inside a function, and one gets out of a function. This helps you understand how your code is working and where development might be going wrong.
DevTools also have a place where you can type and try out code while you're fixing errors. This is good for testing ideas or making quick changes.
#1 Inspecting the Call Stack:
The call stack is a critical concept in programming that helps in comprehending the order of function calls within your code. This concept is immensely valuable for JavaScript debugging because it allows you to track the path of execution that led to an error.
When your code executes, each function call creates a frame on the call stack. This frame holds information about the function, including its parameters, local variables, and the point in your code where the function was called.
The call stack manages these frames in a last-in, first-out manner, meaning the most recently called function resides at the top of the stack.
function multiply(a, b) {
  return a * b;
}

function calculateTotal(price, quantity) {
  return multiply(price, quantity);
}

function displayTotal(total) {
  console.log("Total:", total);
}

const price = 10;
const quantity = 5;

const total = calculateTotal(price, quantity);
displayTotal(total);
In this example, we have three functions: multiply, calculateTotal, and displayTotal. When you run this code, the call stack is populated as follows:
displayTotalfunction callcalculateTotalfunction call (insidedisplayTotal)multiplyfunction call (insidecalculateTotal)
Now, let's say an error occurs in the multiply function. By inspecting the call stack, you can understand that the error originated within the multiply function, which was called from the calculateTotal function, and ultimately from the displayTotal function. This sequence of calls helps you grasp the context in which the error occurred.
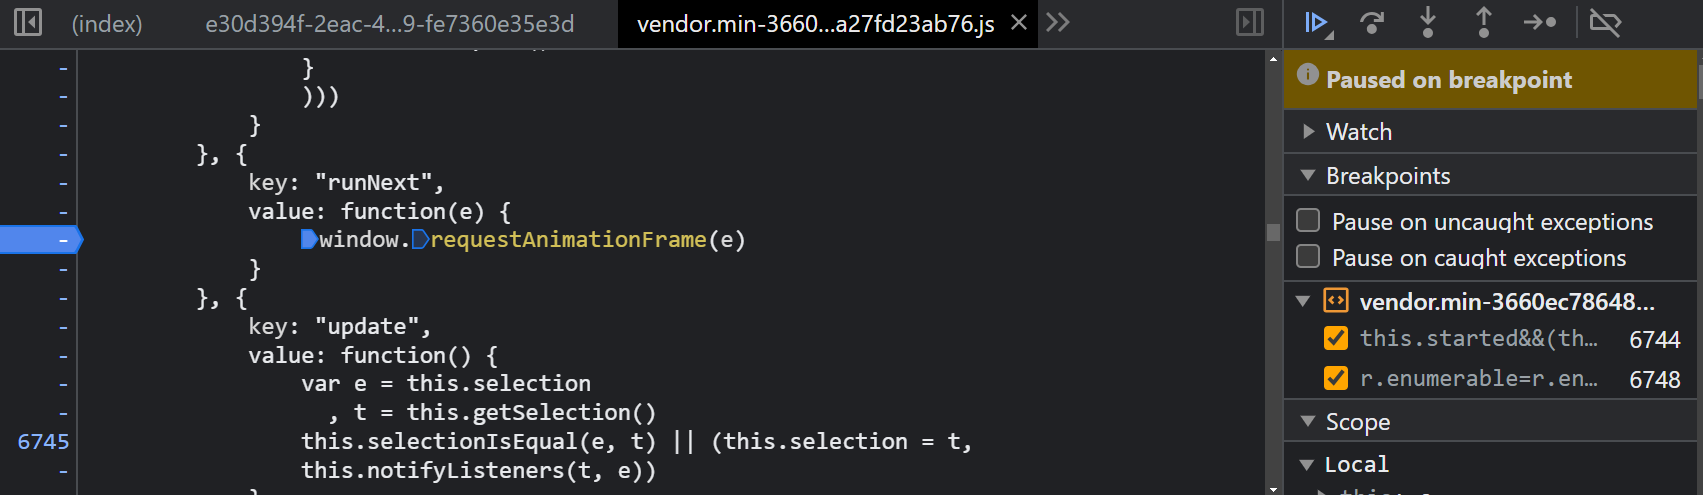
#2 Setting Breakpoints
Setting breakpoints is another advanced technique in JavaScript debugging that let you control over your code's execution. By pausing the program's run at specific lines, you can inspect variable values and scrutinize how your code behaves at those moments.
This method is particularly useful when pinpointing issues or comprehending complex program flow.
function calculateTotal(price, quantity) {
  debugger; // Breakpoint here
  const total = price * quantity;
  return total;
}

const itemPrice = 10;
const itemQuantity = 5;

const result = calculateTotal(itemPrice, itemQuantity);
console.log("Total:", result);
In this example, a breakpoint is set within the calculateTotal function by using the debugger; statement. When the code runs and encounters this line, the execution halts, allowing you to interactively inspect the program state at that exact moment.
Here's how setting breakpoints helps in JavaScript debugging:
- Stopping the Action: When you reach a breakpoint, your program takes a quick break. This helps you see what's going on with numbers and words, which is super important for finding errors that are acting strangely.
- Checking Values: While the program is taking a break, you can use special tools in your web browser to look at the values. You can put your mouse over to see what they look like right now. Or you can type in to see how they act.
- Figuring Out What's Happening: Breakpoints help you see how your program is doing up to the moment it takes a break. You can go through the steps of your code one by one, watch what happens to the numbers and words, and understand how different parts of your code work together.
- Changing on the Spot: When your program is on a break, you can also change numbers or try out new bits of code. It's like testing right when your program is taking a time-out. This lets you see what happens in real time and helps you understand how your code is acting.
- Tricky Situations: When development get really confusing and it's hard to find out what's wrong, putting in breakpoints is like having a special light that shows you exactly where they get messed up. This can help you fix JavaScript errors faster and more accurately.
You can set breakpoints in developer tools by clicking on the line numbers in the "Sources" tab. Alternatively, you can place the debugger; statement directly in your code where you want the program to pause. This method significantly makes it easier to debug, by letting you to inspect and understand your code's execution in granular detail.
#3 Step Through Code
Stepping through code bit by bit is really important when fixing errors in JavaScript programs. Let's you've stopped your program at a certain spot using a breakpoint. Now you have tools like "Step Into," "Step Over," and "Step Out" that are super useful for understanding what's happening and finding mistakes.
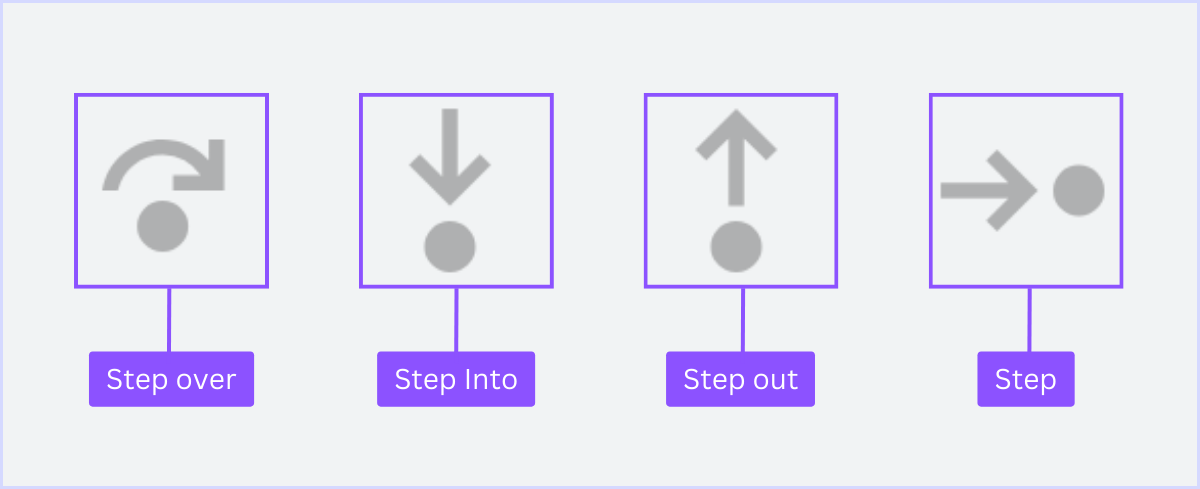
These tools help you move through your code one line at a time, see how they change, and follow how different parts of your code work together.
If you're trying to find a JavaScript error in your code. You put a special stopping point inside a function called "calculateTotal." After you hit the stopping point, you can use the step controls to move through your code like this:
function calculateTotal(price, quantity) {
  const total = price * quantity;
  return total;
}

function displayMessage(message) {
  console.log("Message:", message);
}

const itemPrice = 10;
const itemQuantity = 5;

const result = calculateTotal(itemPrice, itemQuantity);
displayMessage("Total calculated: " + result);- Step Into: If you click "Step Into," it will take you to the next line of code, even if it's inside another function. For example, if you step into the
calculateTotalfunction, you'll go inside it and see how it uses numbers to find thetotal. - Step Over: Clicking "Step Over" makes the function run from start to finish, and then it takes you to the next line where the function was called. If you use this while inside the
calculateTotalfunction, it will find thetotaland then show you the next part of your code. - Step Out: "Step Out" is for leaving the current function and going back to where it was called. If you're inside the
calculateTotalfunction, stepping out will take you back to where you asked thecalculateTotalfunction to start.
So, these steps help you see what's happening in your code bit by bit and are really helpful when you're trying to find and fix errors.
#4 Inspect Variables
Inspecting variables is a fundamental aspect of effective debugging in JavaScript. By checking the values of variables at different points in your code, you gain insights into how your program is behaving and can identify where issues may arise. Here's a detailed explanation with a code example:
function calculateTotal(price, quantity) {
  const total = price * quantity;
  return total;
}

const itemPrice = 10;
const itemQuantity = 5;

const result = calculateTotal(itemPrice, itemQuantity);
console.log("Total:", result);
As you debug this JavaScript code, you might want to inspect the values of itemPrice, itemQuantity, total, and result. Here's how variable inspection can be done:
- Debugger Tab: Open your browser's developer tools and navigate to the "Sources" or "Debugger" tab. This is where you'll find a list of variables available in the current scope.
- Hover Over Variables: Hover your cursor over a variable name in your code. A tooltip will appear, showing the current value of the variable. For example, hovering over
itemPricemight display10. - Watch Panel: In the debugger, you can often find a "Watch" or "Watches" panel. You can add variables of interest to this panel. As you step through your code, the values of these variables will be continuously updated and displayed.
Overall, the ability to inspect variables offers a real-time view into the inner workings of a program, helping the identification and resolution of bugs and logical errors. It's an indispensable tool for maintaining code quality and ensuring software reliability by allowing developers to effectively diagnose issues and improve their codebase.
Using Error Analysis Tools to Debug JavaScript
Even though you can debug most of the JavaScipt errors in your browser, there are too many other errors that are uncaught in the production.
To monitor JavaScipt errors without exceptions you may need a error analysis tools that not only provide you information on debugging but also a in-depth root cause and analysis of your occured errors in real-time.
Developers are now getting smarter with easy JavaScript error analysis tool to debug applications more effectively. It offers a comprehensive suite of features designed to provide deep insights into how your code is executed, allowing you to identify and resolve issues efficiently.
Here are the top error analytis tool that will 100% debug JavaScript:
#1 Atatus
Atatus provides comprehensive insights into JavaScript errors within your web application. This monitoring solution offers a holistic view of issues that impact user experience, enabling swift real-time resolution.
Users can efficiently identify and rectify critical issues using detailed data points, facilitating rapid analysis and troubleshooting.
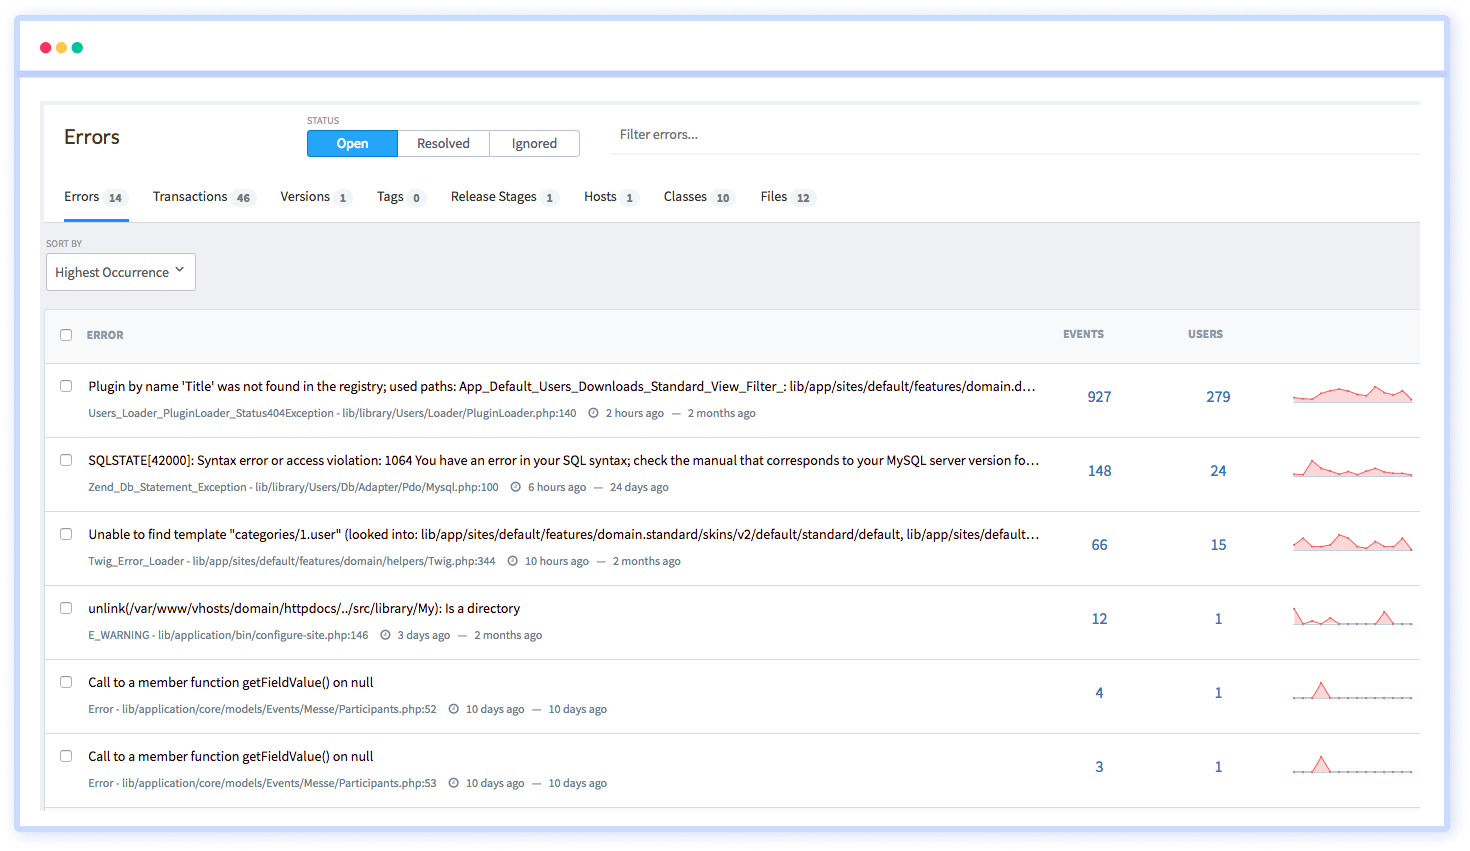
You can delve into specific aspects such as poor route change durations, AJAX breakdowns, JavaScript SPA response times, front-end performance, slow page loading, and user dissatisfaction caused by JavaScript errors or failed AJAX calls.
Atatus meticulously documents every JavaScript error with a full stack trace and highlights the relevant source code line. This allows you to assess the influence of network and geographical factors on user actions, console logs, and JavaScript events, thus enabling precise error resolution.
#2 Sentry
Sentry offers a robust system for debugging JavaScript errors curating them into a searchable list that simplifies error replication.
Instant identification of error is facilitated by performance monitoring tools, aiding in the diagnosis of development project issues.
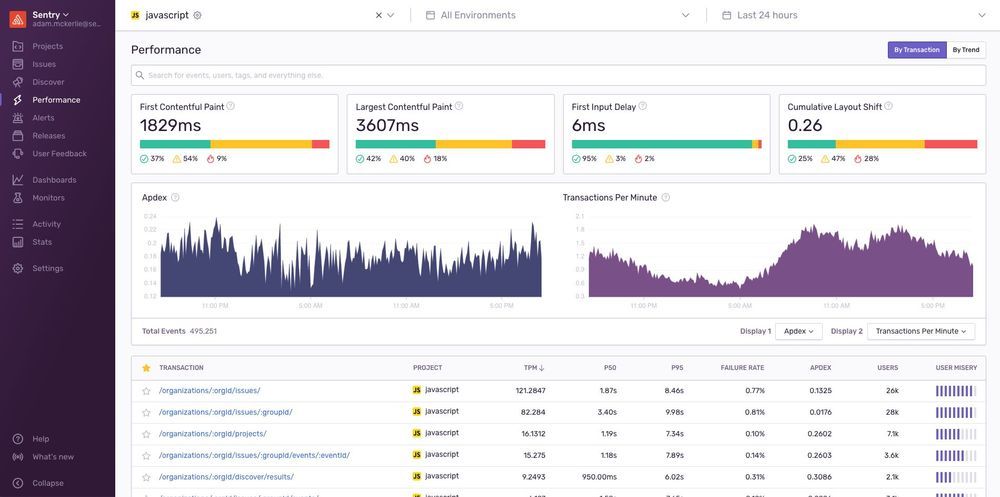
Troubleshooting is streamlined with a stack tracing tool that mimics your development environment, allowing you to swiftly address errors and precisely locate code issues. Sentry's array of JavaScript monitoring tools seamlessly integrates with your runtime environment, taking care of resource-intensive debugging tasks.
For JavaScript, Sentry delivers comprehensive context through full stack traces, seamless synchronization of code via source maps, and direct integration with source code management tools to facilitate issue pinpointing.
Sentry's Issue Details page provides insights into users' devices, operating systems, and browsers, offering a complete perspective on the context surrounding JavaScript incidents.
#3 Bugsnag
Bugsnag is best in monitoring and debugging JavaScript applications, excelling in cross-browser monitoring while automatically pinpointing script issues and categorizing errors.
Support extends to three prominent JavaScript frameworks—React, Vue, and Angular—alongside error-reporting libraries that seamlessly integrate, harnessing specific data from framework error handlers.
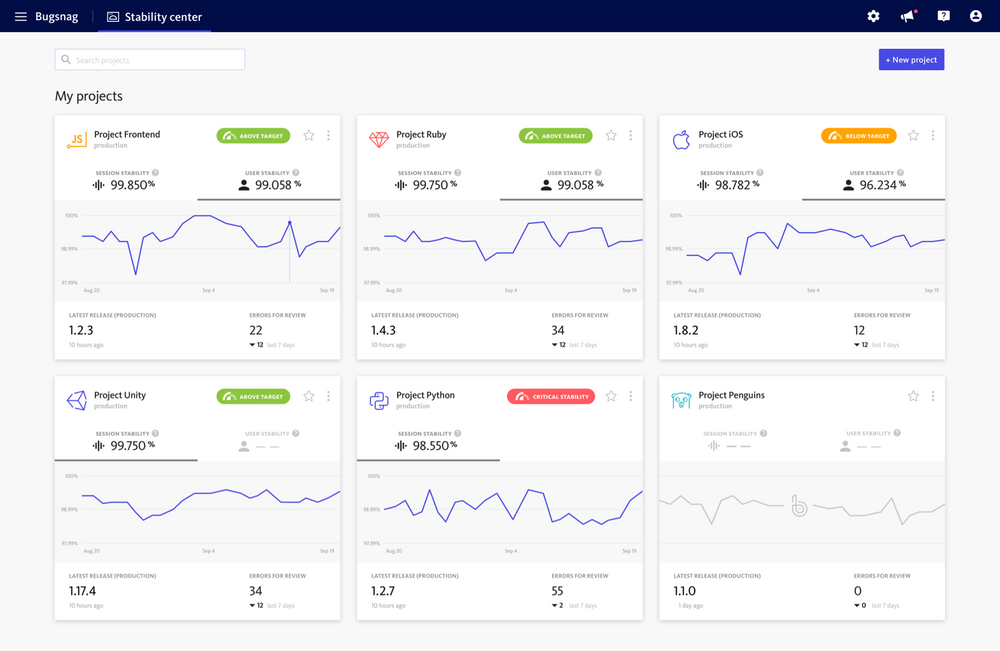
Bugsnag improves user experience by offering multidimensional filtering options for browsers, operating systems, and users. The tool's capabilities comprehend automatic diagnostics, stack tracing, source mapping, breadcrumb collection, and version benchmarking. Notably, Bugsnag provides deployment flexibility, offering both SaaS and self-hosted options.
The platform plugins to React, Vue, Angular, Express, Restify, Koa, Node.js, and React Native. These plugins swiftly detect JavaScript issues in browsers, delivering real-time error notifications, comprehensive diagnostic reports, and cross-platform error recognition, covering both managed and unmanaged incidents.
#4 ReplayBird
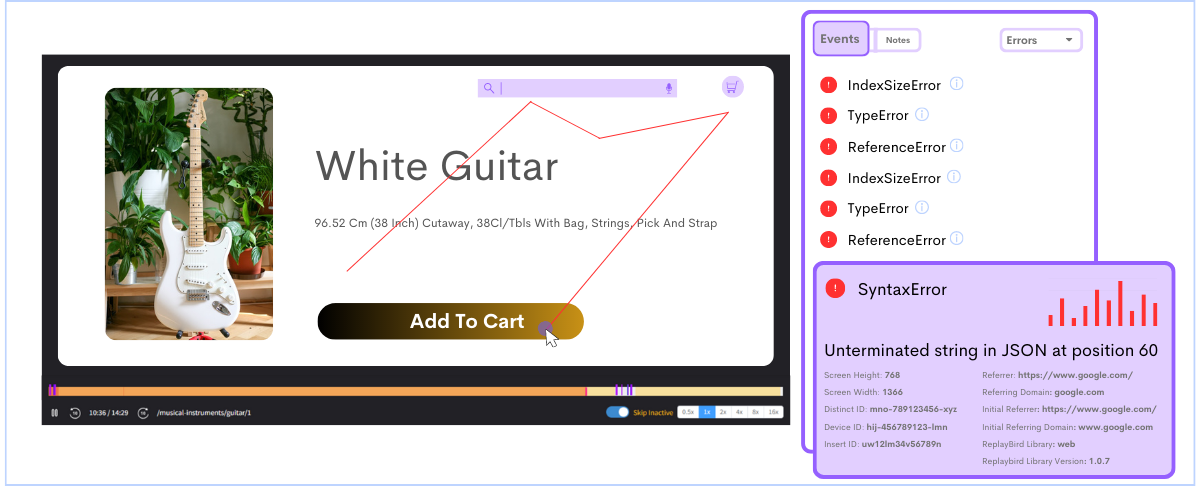
ReplayBird automatically detects and captures JavaScript errors and exceptions. When an error occurs, you receive detailed information about the error type, stack trace, and associated user actions. This information aids in pinpointing the source of the error and understanding the context in which it happened.
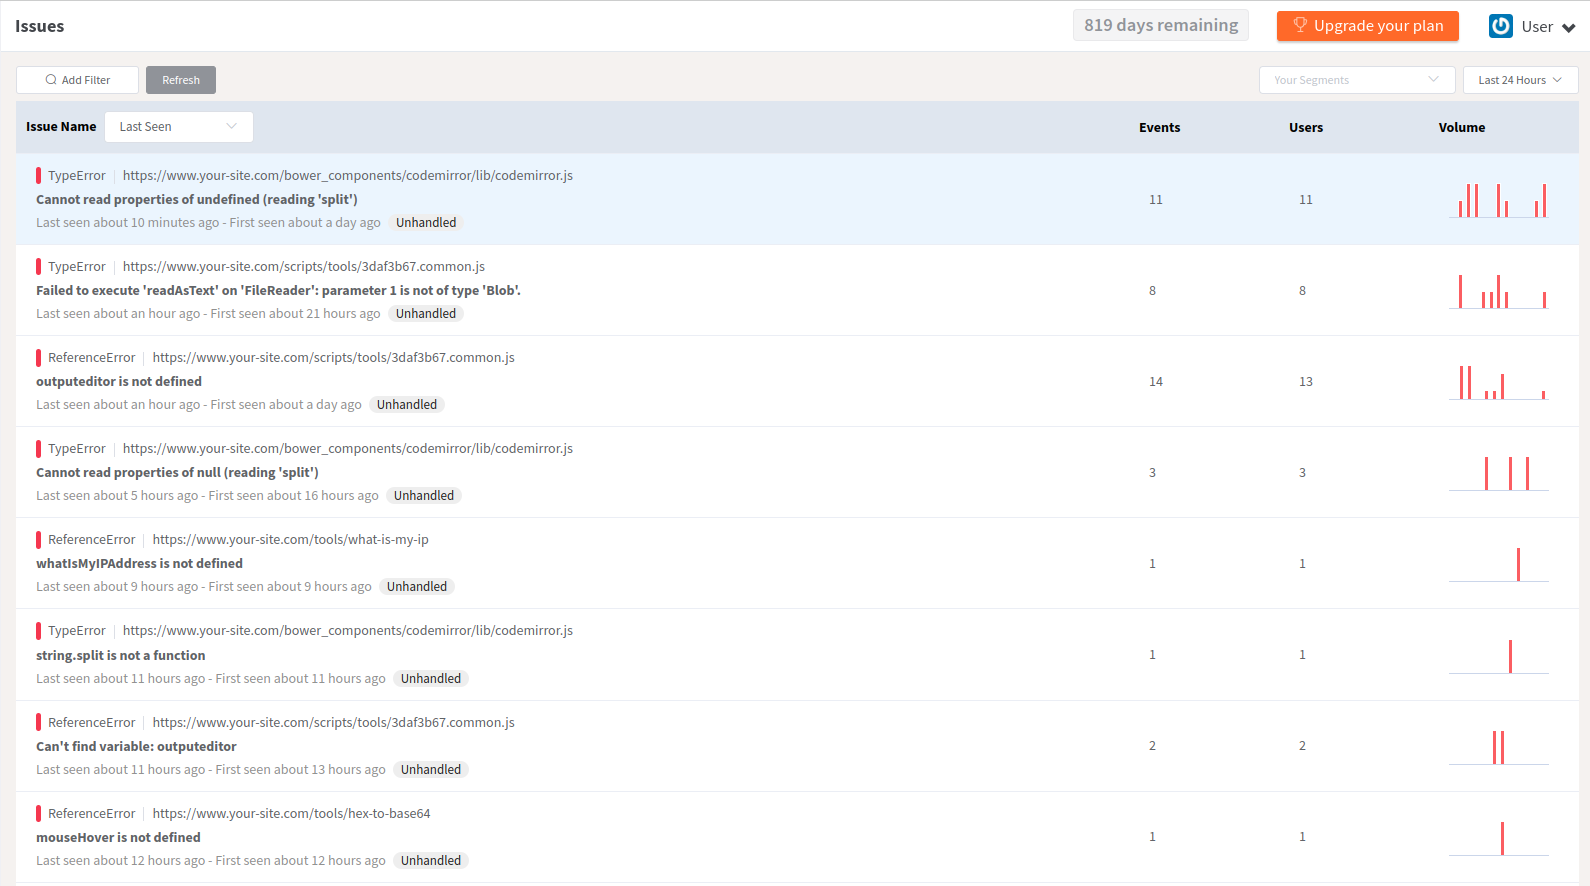
Capture console logs, network requests, and responses. This data is synchronized with the session recording, providing context for the events that occurred during a session. You can analyze console logs and network activity alongside user interactions to identify patterns and potential issues.
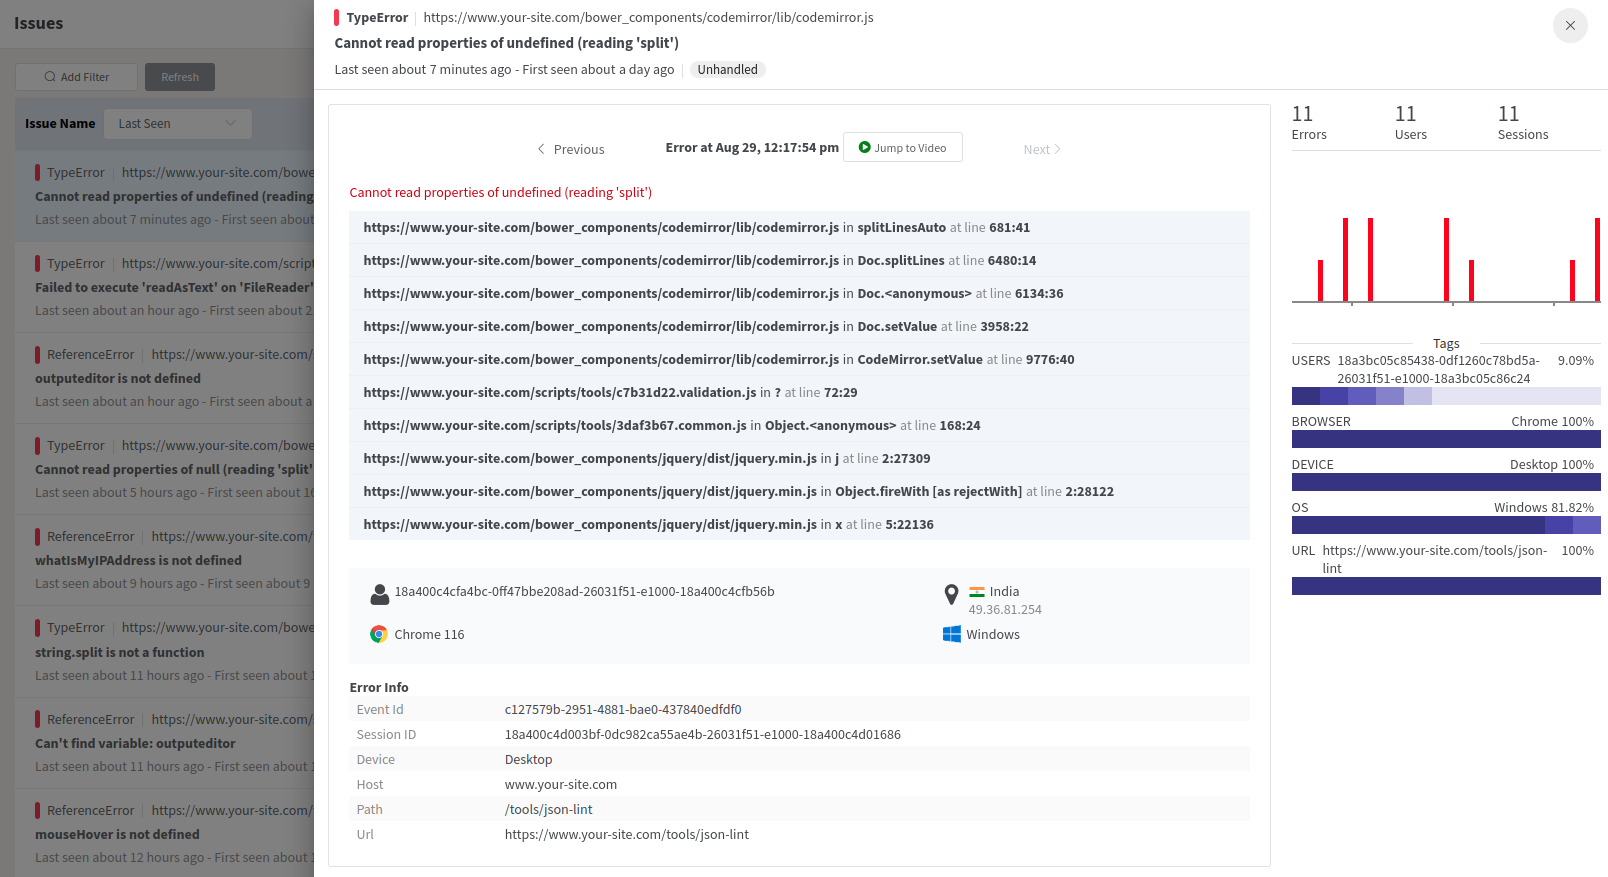
But apart from other other error analysis tools, ReplayBird records user interactions and the corresponding application behavior. This let you even jump from error to session directly where user encountered the error and what exactly users did. By replaying these sessions, you can visually understand the steps leading to the error and reproduce it in a controlled environment with this session replay feature.
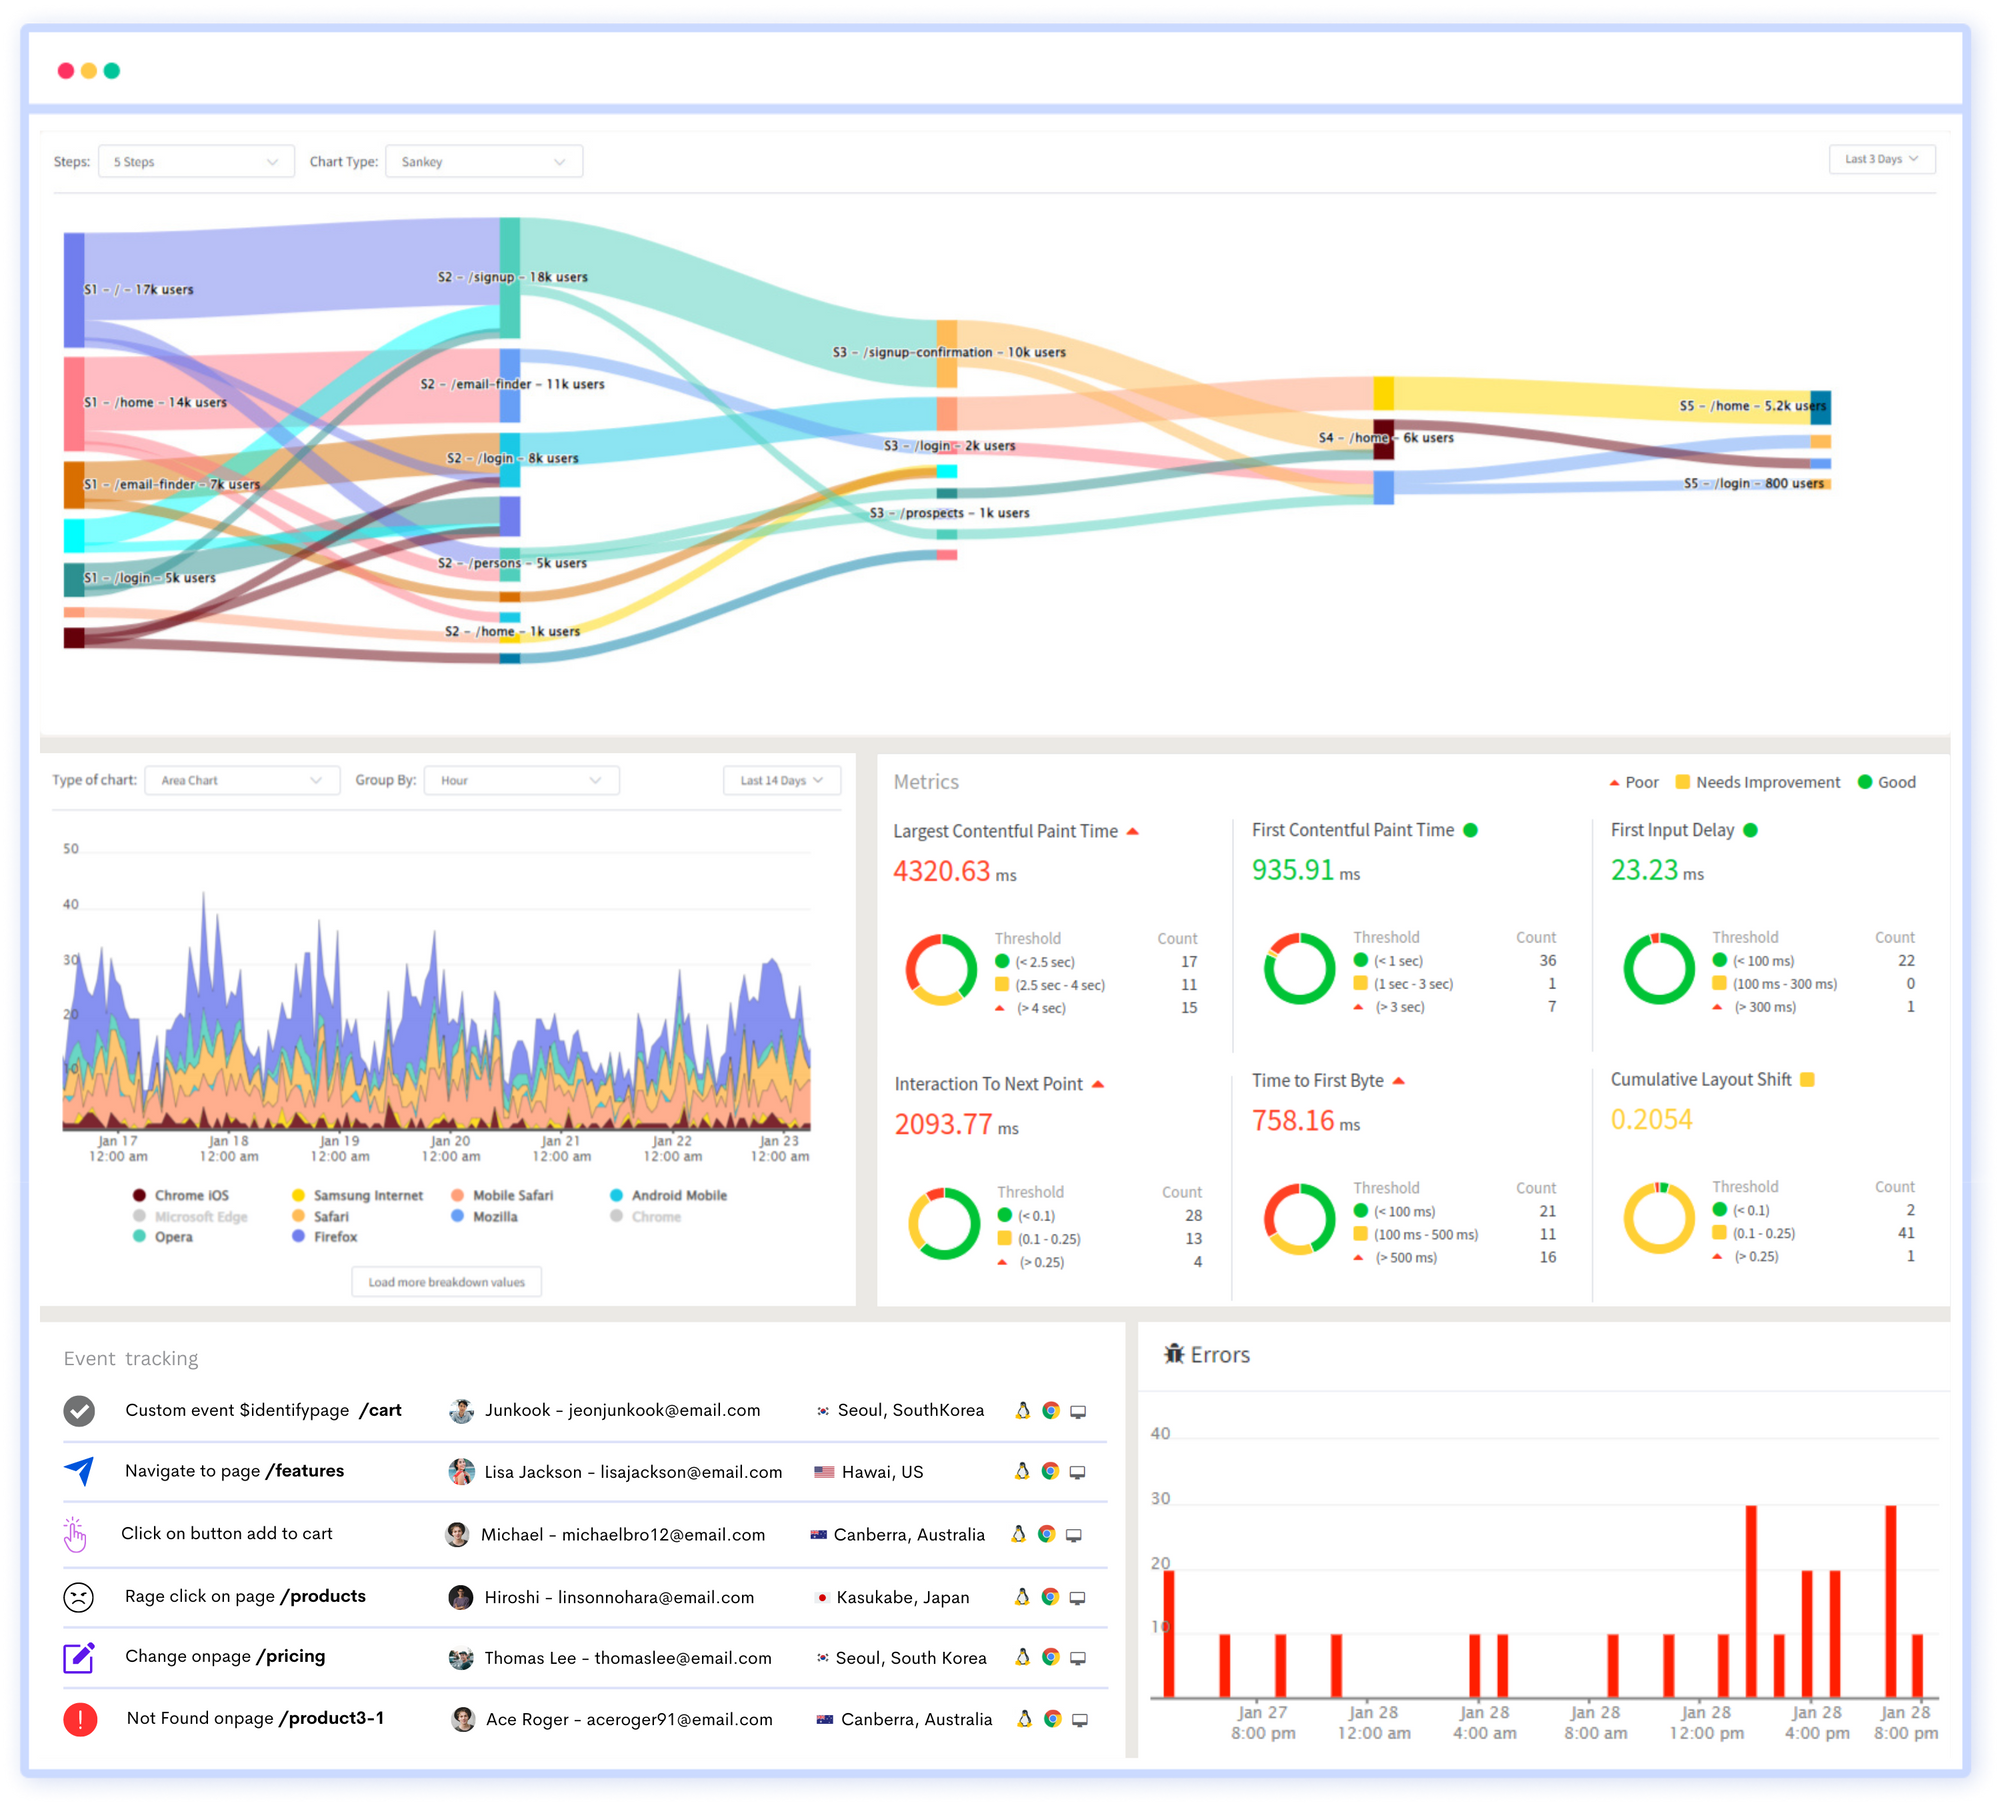
Error analysis tools like ReplayBird improves JavaScript debugging by providing a combination of session replay, console logs, error tracking, and timeline visualization to quickly identify, understand, and resolve issues, resulting in more efficient and effective debugging processes.
Conclusion:
Debugging JavaScript errors involves looking at the order of functions in the call stack, carefully picking where to pause your code with breakpoints, moving through your code step by step, and checking the values of variables to understand what's happening.
All of these methods come together to make a complete way of fixing errors, helping developers handle issues faster and make their code better.
In the end, getting really good at debugging in JavaScript helps developers make strong and dependable applications.
By following a clear way to solve errors, using tools like the console and the "debugger" statement, and being skilled at using the browser's special tools, developers can make fixing errors easier and find smarter answers to errors in their code.
Keep Reading More on JavaScript:
 Velantina
 Velantina
 Uma
Uma

