The Performance tab holds a lot more insights than you actually expect free metrics to yield in every domain, particularly for development and business analytics. It serves as a pivotal tool for measuring, analyzing, and optimizing different aspects of performance.
In computing, the Performance tab within task managers or system monitoring tools offers real-time insights into the utilization of CPU, memory, disk, and network resources. It lets you identify resource-intensive applications or processes, diagnose system bottlenecks, and optimize performance by reallocating resources or terminating problematic tasks.
This tab serves as a dashboard for administrators, so that you can maintain system health, troubleshoot issues, and have optimal functionality.
In business analytics, the Performance tab plays a crucial role in evaluating key performance indicators (KPIs), tracking metrics, and assessing the overall health and progress of an organization. It provides advanced analysis of sales figures, financial data, market trends, and operational efficiency, helping in strategic planning, performance evaluation, and the identification of areas needing improvement.
- What is Performance Tab?
- Why User Performance Tab?
- How to Start with Performance Tab?
- 6 Insightful Performance Tab Metrics
What is Performance Tab?
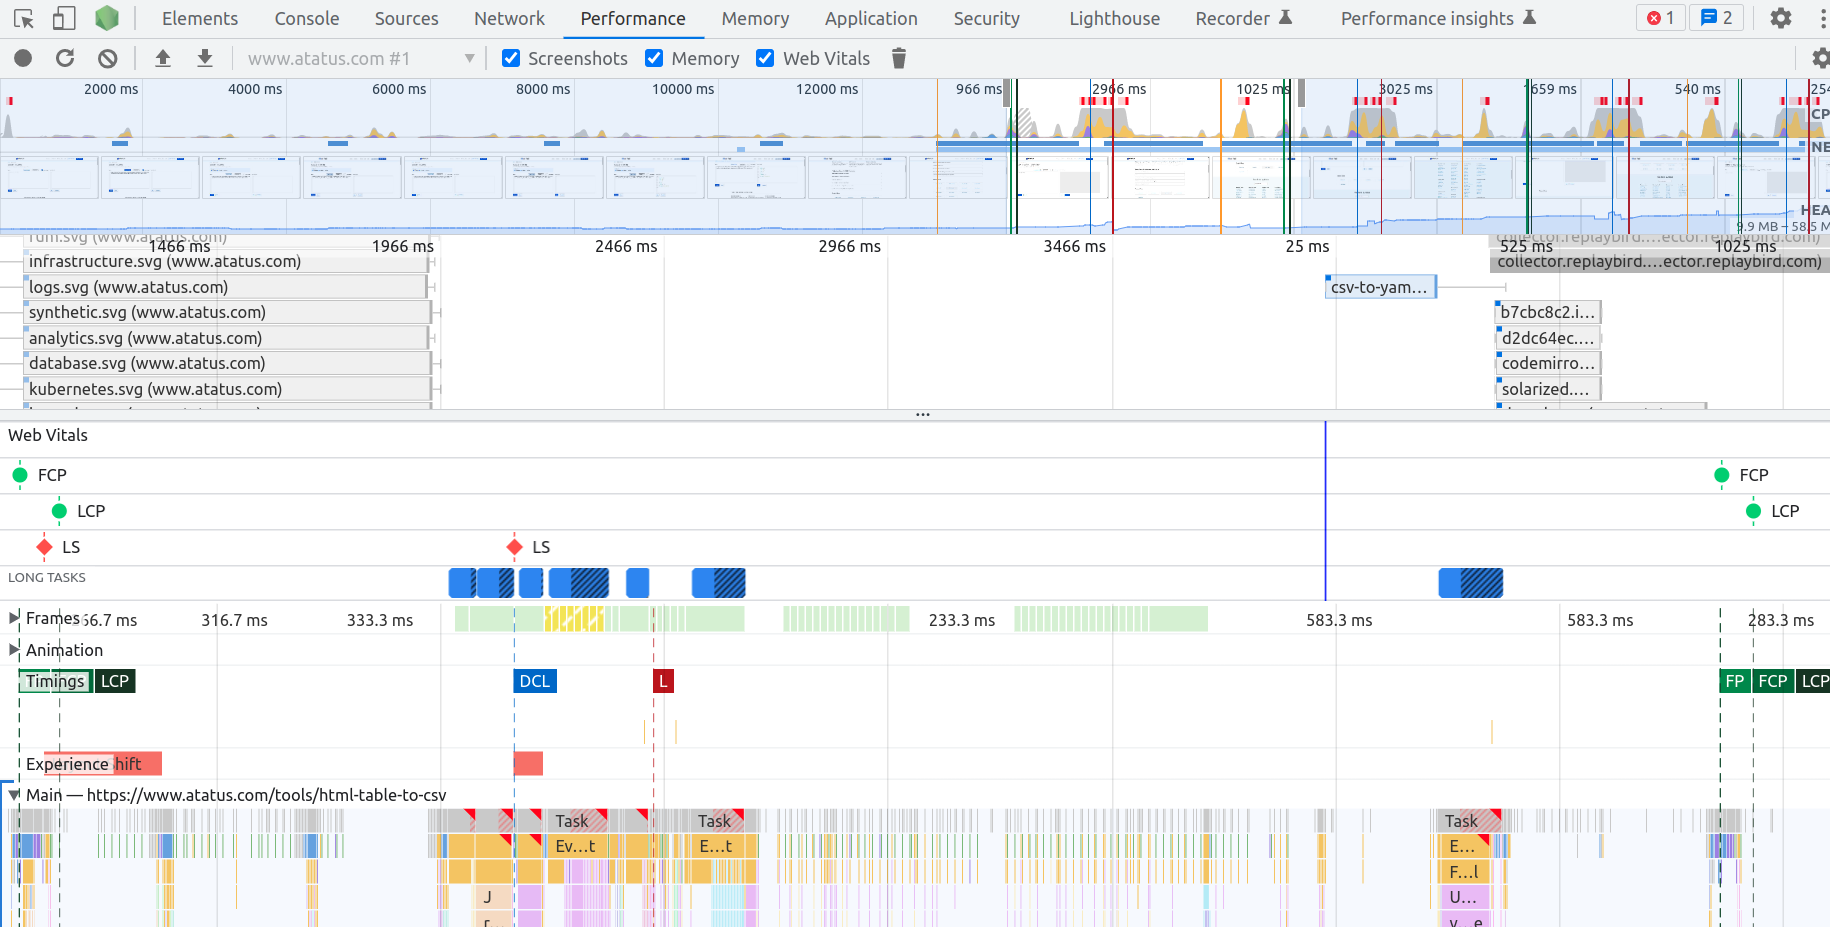
The Performance tab in Chrome DevTools helps us understand and improve how fast a website loads and runs by measuring how long different parts take to load and execute. When you open the Performance tab and start recording, Chrome begins tracking everything that happens as your webpage loads. It captures details like network activity (like fetching files), JavaScript execution, and rendering time. Once you stop recording, it presents this data in a comprehensive timeline graph.
For instance, if your website feels sluggish, you can use the Performance tab to identify the exact moment or process causing the slowdown. You might discover that a particular JavaScript function takes a long time to execute or that a large image is delaying the page load.
By analyzing this data, we can optimize code, tweak resource loading strategies, or fix issues that hinder performance. They can make adjustments to improve the website's speed and provide users with a smoother experience.
In simpler terms, the Performance tab in Chrome DevTools is like a speedometer and diagnostic tool combined, helping us find and fix speed-related problems on websites to make them faster and more responsive.
Why User Performance Tab?
- Identifying Performance Bottlenecks: Pinpoints slow-loading resources, code inefficiencies, or rendering issues causing delays in website loading and responsiveness.
- Measuring Loading Times: Provides precise measurements of elements' loading times, aiding in prioritizing optimization efforts for scripts, stylesheets, images, and other assets.
- Analyzing Network Activity: Visualizes network requests, suggesting opportunities to optimize resources by reducing file sizes, caching, or minimizing requests.
- JavaScript Profiling: Analyzes JavaScript execution times, pinpoints functions causing performance issues, and allows code optimization for better efficiency.
- Understanding Rendering Performance: Offers insights into rendering processes (layout, paint, composite times), optimizing page rendering for smoother user experiences.
- Assessing User Interactions: Analyzes user interactions and associated performance, identifying delays between user actions and website response.
- Performance Audits: Conducts audits and offers recommendations, allowing us to run tests and receive suggestions for improving website speed and performance.
- Testing Changes and Optimizations: This let us to test code, resource, or configuration changes to gauge the impact on performance, ensuring improvements are made effectively.
How to Start with Performance Tab?
To begin using the Performance tab in Chrome DevTools to analyze and improve website performance, follow these steps:
Access DevTools: Open Google Chrome, go to the webpage you want to analyze, and press F12 or right-click on the webpage and select "Inspect" to open DevTools.
In the DevTools panel, locate and click on the "Performance" tab. It might be in a different position depending on your Chrome version, but it usually looks like a line chart or a speedometer icon.
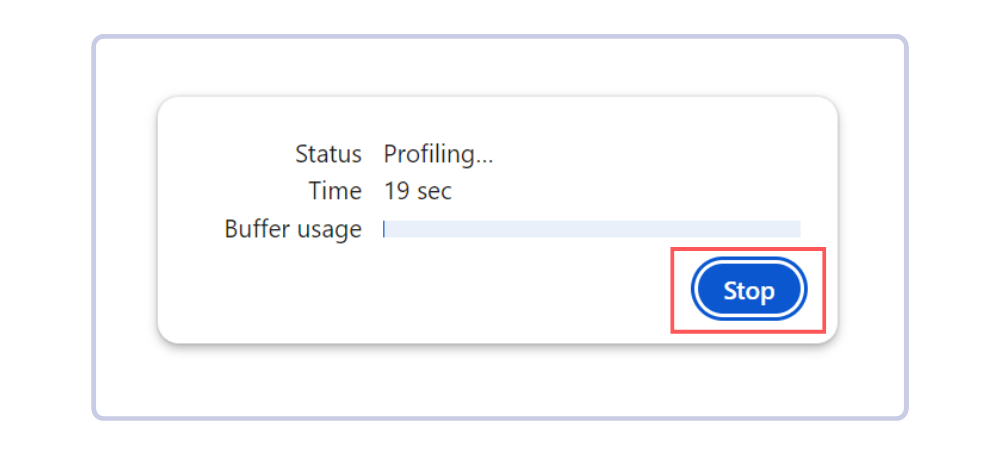
Start Recording: Click the circular record button or use the keyboard shortcut (Ctrl + E or Cmd + E on Mac) to start recording the performance data. Refresh the webpage or interact with it to capture performance data during different actions.
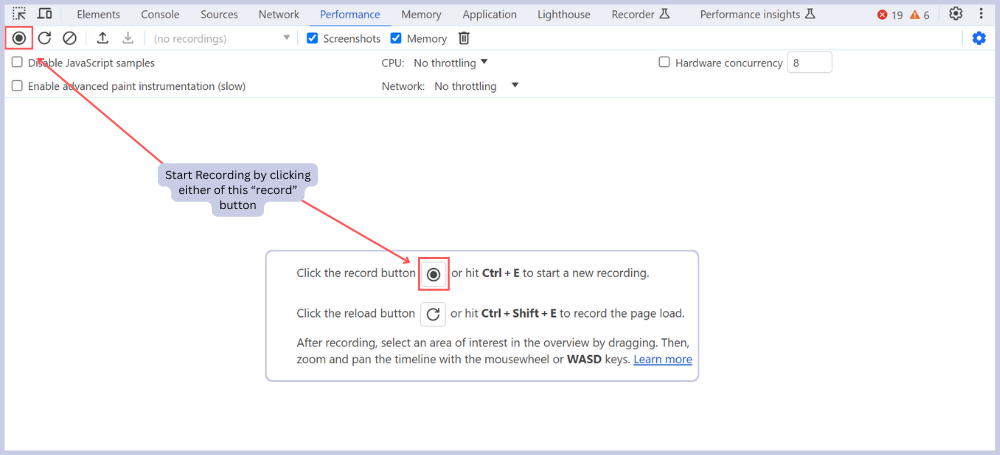
Stop Recording: Once you've performed the actions you want to analyze, click the record button again or use the same keyboard shortcut (Ctrl + E or Cmd + E) to stop recording.
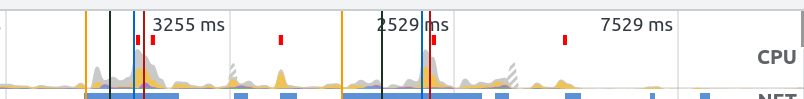
Review the timeline that appears after recording. Look for areas where there are spikes, long tasks, or gaps. You can zoom in/out, select specific sections, and view detailed information on various events (e.g., network activity, JavaScript execution, rendering).
6 Insightful Performance Tab Metrics
1. CPU Utilization Timeline:
With CPU Utilization Timeline in Chrome DevTools' Performance tab you can track how intensively the CPU is engaged during the operation of a webpage.
This graphical representation shows the fluctuations in CPU activity over time, highlighting periods of high usage due to different tasks and processes during page loading or user interactions.
By analyzing this timeline, we can spot instances of heightened CPU activity, identifying resource-heavy operations that may impact our performance. Also, these are particularly important for your code optimization and execution, alleviating computational strain.
On the Stripe homepage, there's a noticeable decline in CPU activity after the initial burst, insisting on efficient resource usage. Conversely, the Asana homepage's CPU remains consistently busy post-loading, potentially causing slower interactions, particularly on devices with lower processing capabilities.
Such observations prompt us to fine-tune resource management and code efficiency to create a more responsive browsing experience, especially on less powerful devices.
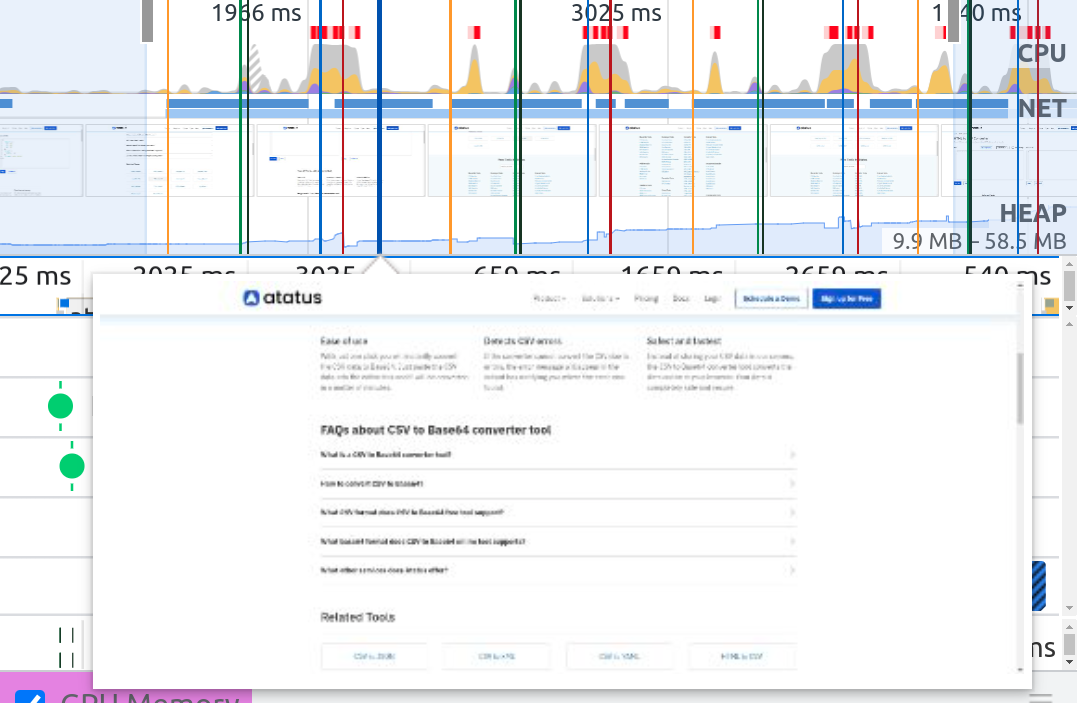
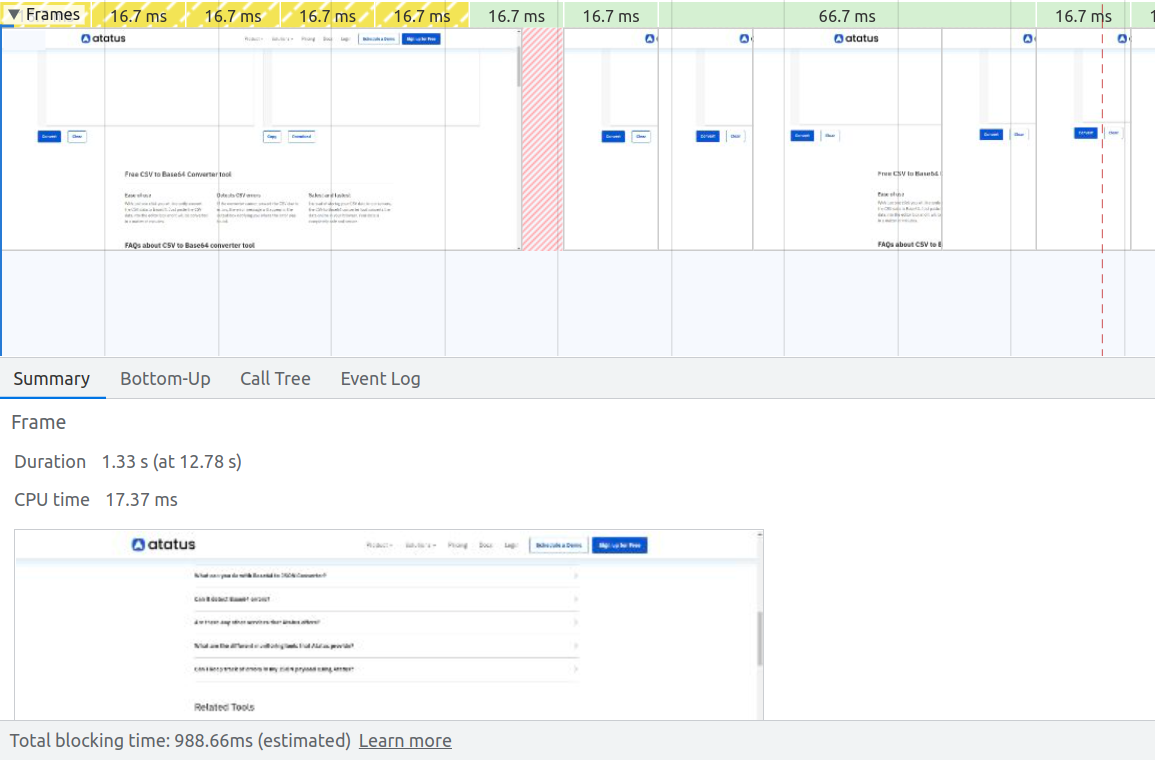
2. Filmstrip Rendering:
Filmstrip Rendering in Chrome DevTools' Performance tab is a visual representation displaying snapshots of a webpage's rendering process at specific intervals over time.
It captures screenshots of the webpage as it loads or during interactions, displaying how the content appears at different stages, which provides a sequential view of the rendering progression and highlights loading delays or rendering issues.
You can also use Filmstrip to visually identify when critical content becomes visible to users, helping to optimize loading sequences and prioritize content rendering.
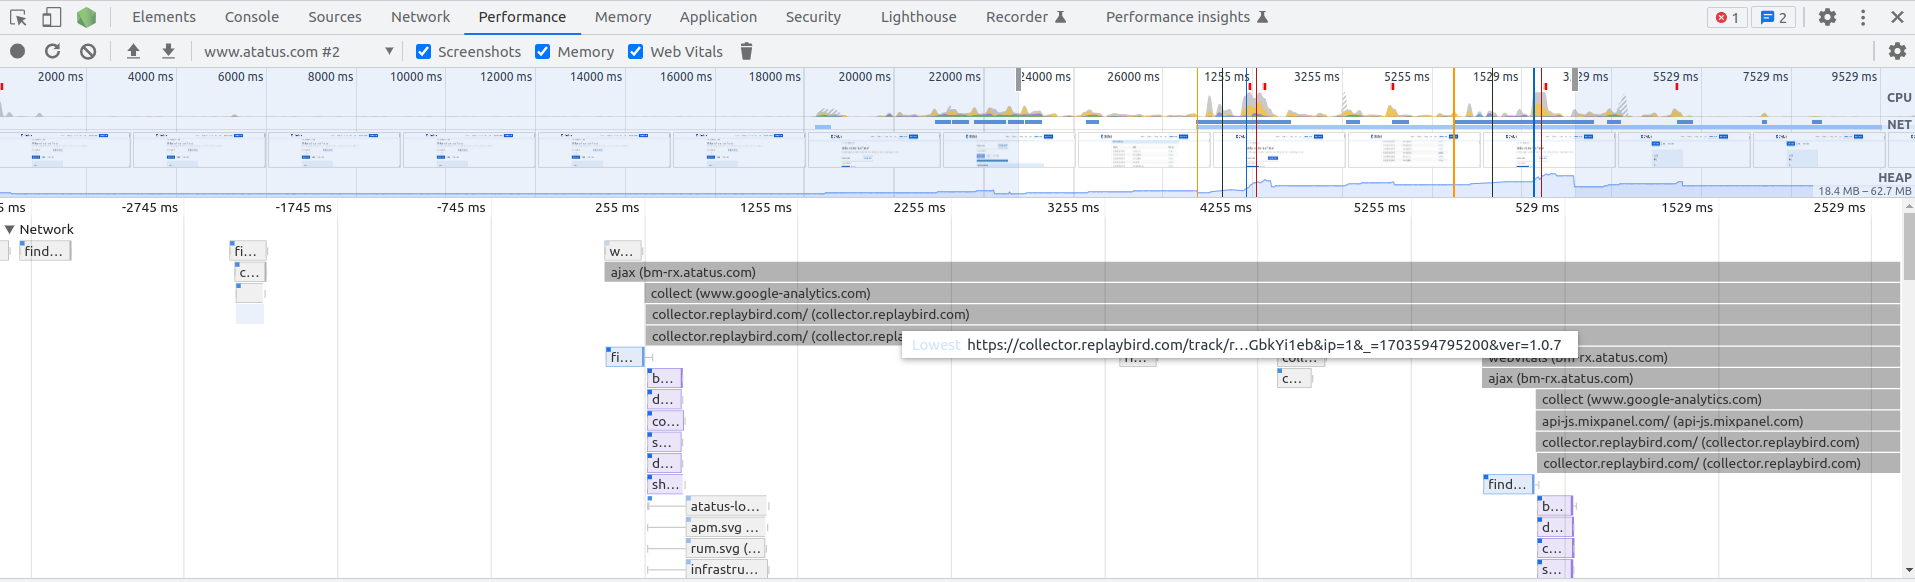
3. Network Request Timeline:
The Network Request Timeline within Chrome DevTools' Performance tab shows the chronological sequence of network activities that occur during the whole webpage's loading process. It displays detailed information about each network request, including their initiation, duration, and completion times.
This timeline shows the fetching of resources like HTML, CSS, JavaScript, images, and other assets for us to identify slow or stalled requests, detect unnecessary or redundant network activity, and optimize resource loading strategies.
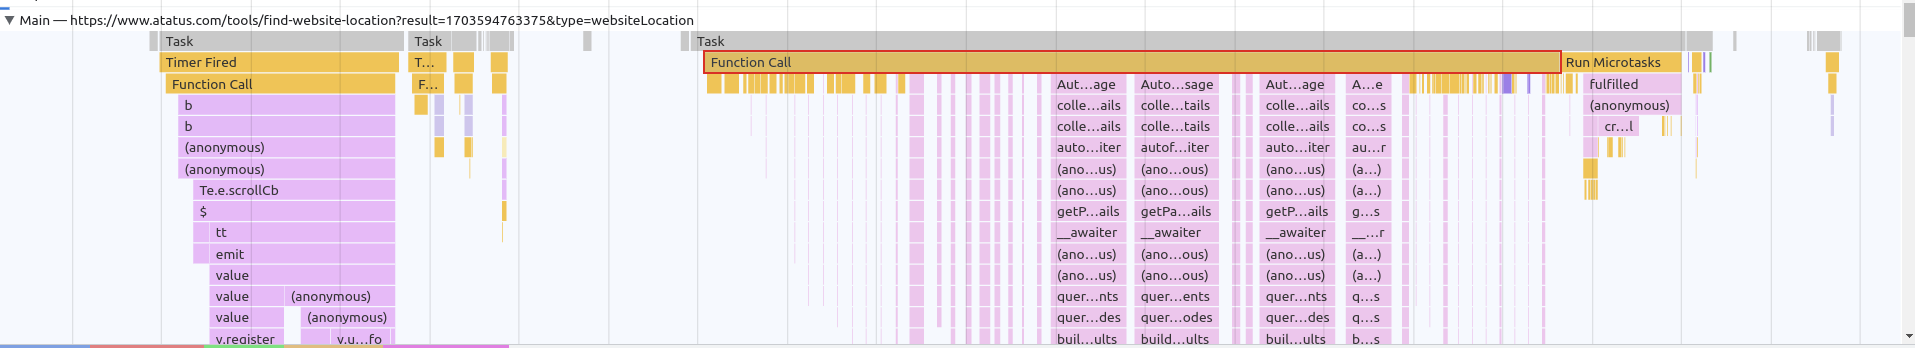
4. CPU Flame Chart:
The CPU Flame Chart in Chrome DevTools' Performance tab provides a hierarchical visualization of CPU activity during webpage execution. It presents a stacked representation where each horizontal bar represents a function or task, showcasing their duration and how they relate to each other.
The width of each bar indicates the time taken by the function, so that we can identify which functions consume the most CPU time. This visual tool helps pinpoint performance bottlenecks, inefficient code segments, and areas causing high CPU usage, aiding in optimizing critical paths.
5. Frames and Frame Rate (FPS):
Frames and Frame Rate (FPS) in Chrome DevTools' Performance tab analyze a webpage's visual rendering performance. Frames refer to individual snapshots or renderings displayed per second on the screen.
The Frame Rate (FPS) metric measures how smoothly these frames are rendered, with higher FPS indicating a smoother experience. DevTools monitors and displays FPS alongside other performance metrics, so that we can identify rendering issues, jank (stuttering or jerky motion), and frame drops that impact user experience.
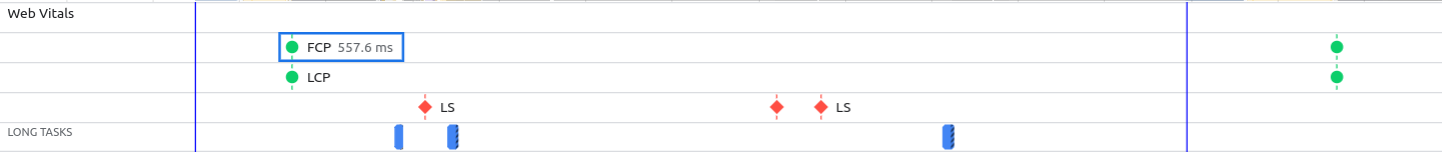
6. Web Vitals and Timings:
Web Vitals and Timings in Chrome DevTools' Performance tab focus on critical metrics assessing user-centric performance.
- Largest Contentful Paint (LCP): LCP measures the time it takes for the largest content element on a webpage to become visible within the user's viewport. It indicates when crucial content loads, giving insights into perceived loading speed.
- First Input Delay (FID): FID evaluates a user's interaction responsiveness by measuring the time between a user's first interaction (like clicking a button) and the browser's response. It reflects the site's interactivity.
- Cumulative Layout Shift (CLS): CLS quantifies the unexpected shifting of elements during page load. It assesses visual stability, indicating if elements on the page unexpectedly move and potentially disrupt user experience.
These speed analysis metrics quantify user experience aspects such as page loading, interactivity, and visual stability. Timings detail various stages of webpage loading, including DNS resolution, initial connection, server response, and DOMContentLoaded.
By monitoring Web Vitals and Timings, we gain insights into user-perceived performance, letting us to pinpoint issues, optimize crucial loading stages, and prioritize improvements for a faster, more responsive, and user-friendly website experience.
Unlock the potential of Chrome DevTools' Performance tab to elevate your website's speed and user experience. Leverage these key features to diagnose issues, optimize critical components, and let your site deliver exceptional performance across diverse user scenarios.
Conclusion:
Overall, the Performance tab serves as an indispensable tool across various domains, offering valuable insights that drive optimizations, improvements, and informed decision-making processes, ultimately contributing to enhanced efficiency, productivity, and success.
Key Takeaways:
The Performance tab offers valuable insights across various domains. In computing, it helps identify resource-intensive applications and system bottlenecks. In business analytics, it evaluates KPIs, tracks metrics, and aids in strategic planning.
The Performance tab in Chrome DevTools measures website loading and execution times, capturing network activity, JavaScript execution, and rendering details in a comprehensive timeline.
It helps identify bottlenecks, measure loading times, analyze network activity, profile JavaScript, understand rendering performance, assess user interactions, conduct performance audits, and test optimizations.
Starting with the Performance Tab: It provides a step-by-step guide on accessing the Performance tab, starting and stopping recordings, and analyzing the timeline for spikes or gaps.
Insightful Metrics within the Performance Tab: It details six specific metrics:
- CPU Utilization Timeline: Tracks CPU engagement over time.
- Filmstrip Rendering: Visualizes webpage rendering at different stages.
- Network Request Timeline: Shows chronological network activities.
- CPU Flame Chart: Hierarchical visualization of CPU activity.
- Frames and Frame Rate (FPS): Analyzes visual rendering performance.
- Web Vitals and Timings: Focuses on user-centric performance metrics like LCP, FID, and CLS.
Understand Exactly How Your Users Interact with Your Website
ReplayBird, a digital user experience analytics platform designed specifically for Website developers with advanced insights to optimize your Website like a pro!
Unleash the power of behavioral insights with ReplayBird's intuitive heatmaps, session replays, and clickstream analysis, which allows you to visualize user behavior, identify popular elements, and detect pain points that might hinder user satisfaction.
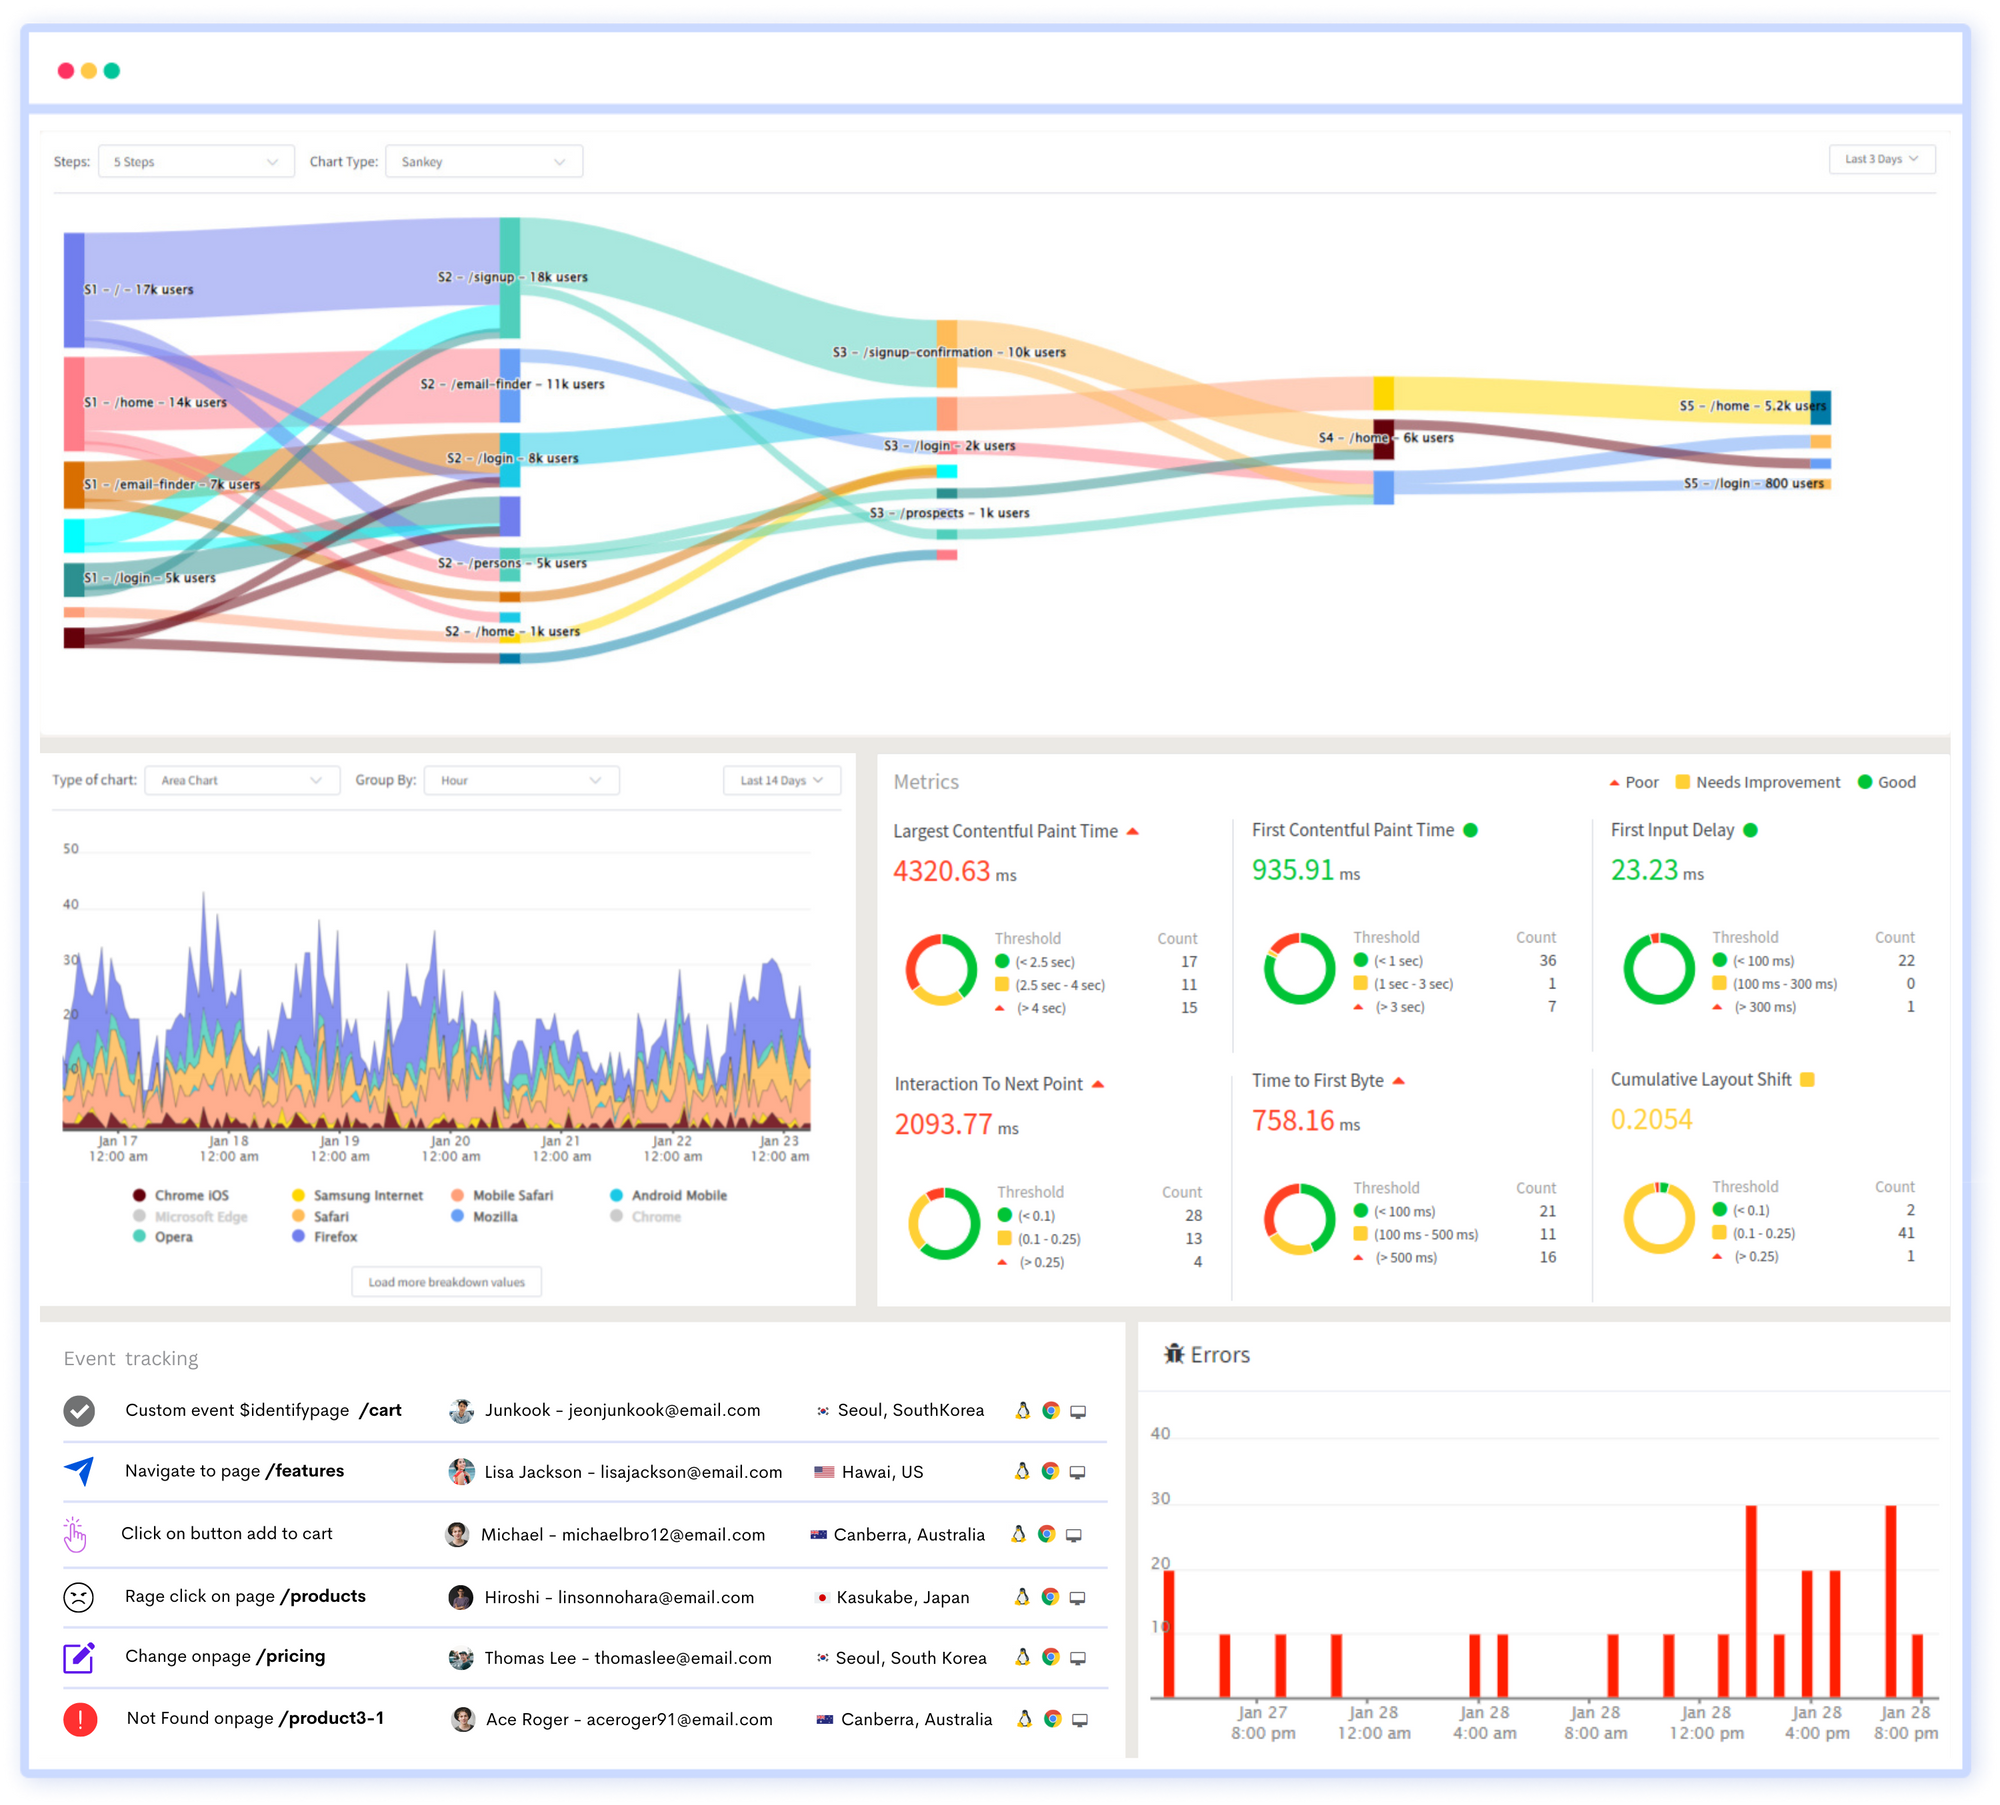
Customer journey analysis and conversion funnels of ReplayBird to analyze deeper into user journeys, identify where drop-offs occur, and uncover conversion blockers.
Troubleshooting is now simpler with ReplayBird's robust debugging features. Detect and diagnose UX issues quickly, ensuring a seamless user journey from start to finish.
With ReplayBird, you have the ultimate toolkit to elevate your website projects to the next level. The platform empowers you to create high-performing, user-centric applications that leave a lasting impression.
Try ReplayBird 14-days free trial
Keep Reading More on API:
 Velantina
 Velantina
 Velantina