Heatmaps can be an extremely powerful tool in website analytics, monitoring, and designing if used correctly and inferences are not derived from little amounts of data.
They will provide insight that other analytics tools will not provide.
Leveraging heatmaps during the CRO campaign could be beneficial in identifying developmental opportunities for testing.
Furthermore, every one of the examples in this section has been used to guide A/B tests on modifications to page layouts as well as functionality in order to successfully meet user interest.
What is a Website Heatmap?
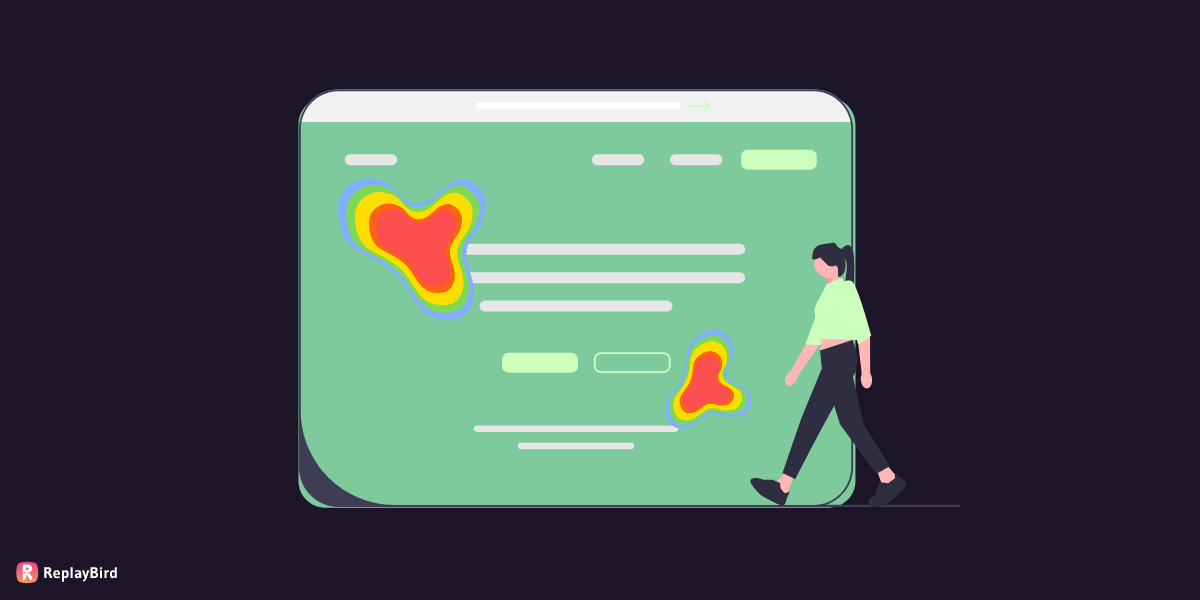
A website heatmap reveals how viewers react to each element in your website.
It uses colors in a range of red to blue to highlight which areas of a webpage receive the most clicks (hot) and that are ignored (cold).
Heatmaps assist spot trends and optimizing for future engagement by combining user activity and providing an at-a-glance insight.
Heatmaps often display the fold, which is the amount of the page that users see without scrolling as quickly once they arrive on it.
Why use a website heatmap?
Visualize website users’ activity using heatmaps.
It is easier to identify flaws and chances for improvement by considering an overview of all user interactions on a web page.
Moreover, the website heatmap is also an excellent starting point for future user behavior research.
It analyzes session records and gathers information and feedback.
1. Choose a particular target
Companies sometimes put more than one call to action (CTA) into our content, which complicates our visitors.
Using heatmaps, you can determine which CTA receives the most results and engage that as your primary focus.
2. Take out any distracting stuff
A further vital thing to utilize a heatmap is that it tells you if your visitors are clicking on non-clickable components, photos, and white spaces while ignoring regions where they should be focusing their attention.
Such information can be life-changing because it allows you to delete extraneous pieces, add links where they are needed, restructure the empty spaces, and guide visitors to the appropriate locations.
3. Design the perfect website layout
A heatmap shows you where visitors click as well as where they do not click.
With all this understanding, you can change the website’s look but recognize it immediately.
How to create a Website Heatmap?
Heatmaps may be built using some Analytics tools like ReplayBird.
Some combined solutions allow you to create heatmaps to investigate the performance of the website in line with your CRO efforts.
Moreover, heatmap analyses thousands of engagement data points using a little code snippet named Smartcode.
It is injected into your site, resulting in a powerful behavioral visualization tool.
Types of Website Heatmaps
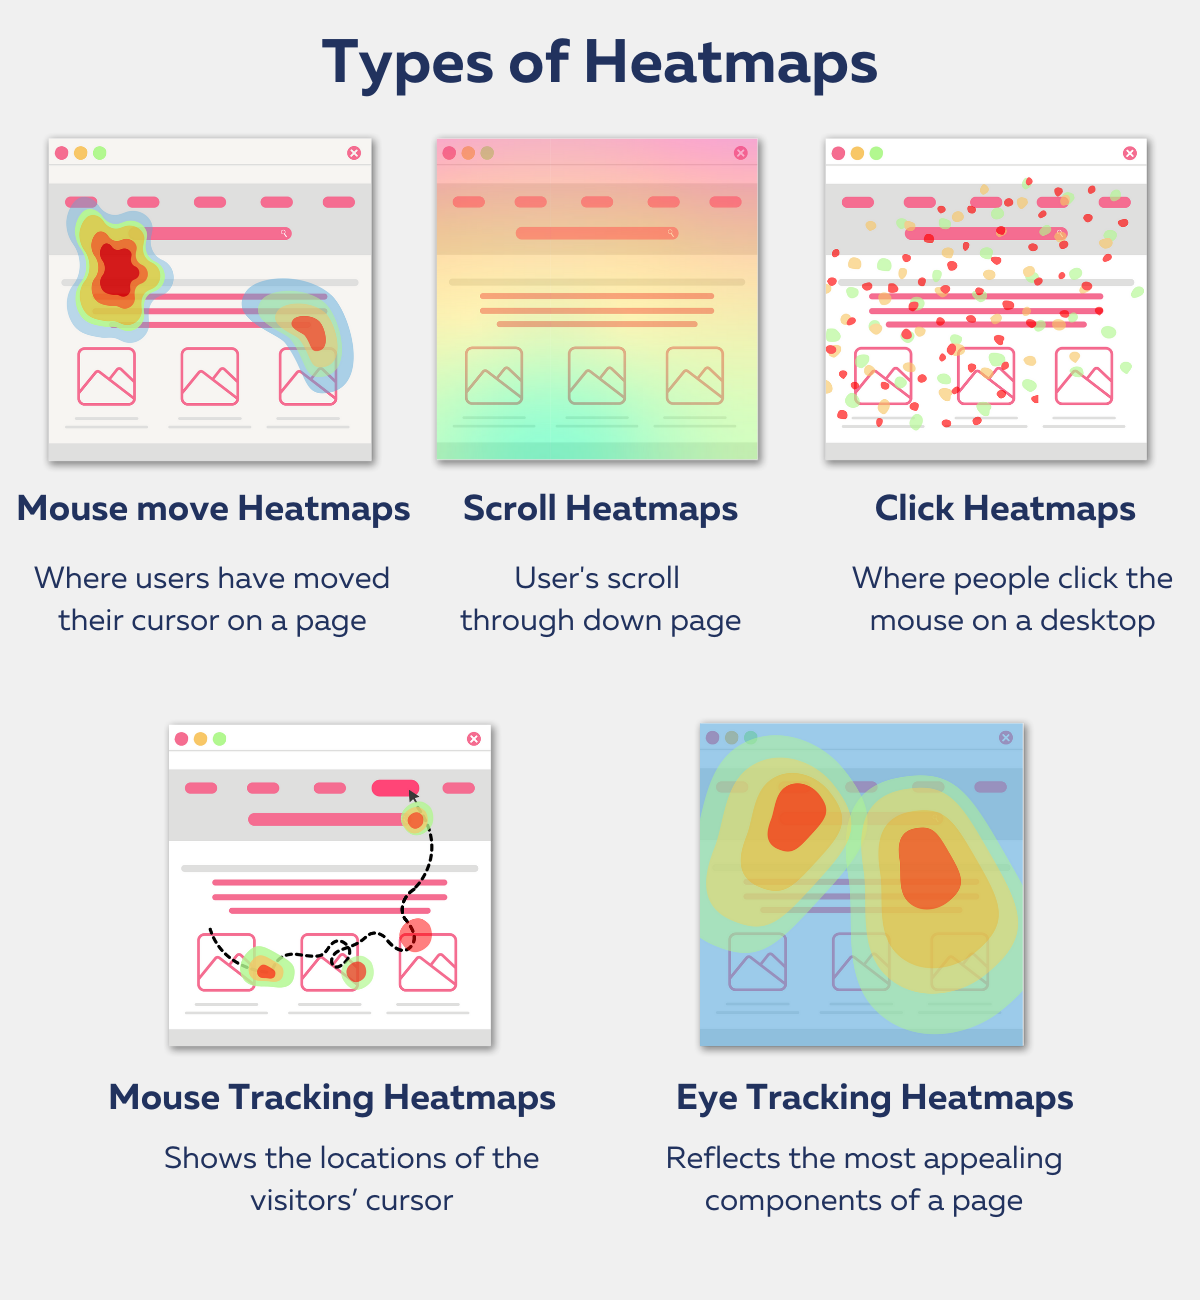
1. Click Heatmaps
A click map is a sort of website heatmap that shows where people click the mouse on a desktop as well as tap the screen on a device.
Also, click maps assist website owners in tracking on-page user involvement throughout a website.
This allows them to optimize their pages or CTAs for higher conversion.
2. Scroll Heatmaps
A scroll map is a form of website heatmap that illustrates how much further down page users scroll.
3. Mouse Move HeatMaps
Move maps track desktop users’ mouse movements as they explore the website.
The hot spots in a moving map represent where users have moved their cursor on a page.
Moreover, there is a similarity between where people are looking and where their mouse is.
Move map gives you a sign of where people may be looking as they navigate through your page.
4. Mouse Tracking Heatmaps
Tracking of the Mouse Heatmaps shows the locations where visitors’ cursor is most of the time.
Mouse tracking heatmap uses:
- Determine which areas visitors spend the most time in.
- Then insert critical information, primary CTAs, necessary adverts, and so on in those sections.
- Analyze where a visitor’s mouse pauses and where they hover by at a higher speed to gain insights.
- Where they are looking when exploring your website.
Mouse tracking heatmaps can assist in determining where visitors spend the most and least amount of time.
5. Eye-tracking Heatmaps
Eye-tracking heatmaps reflect the most appealing components of a page for visitors in the form of “hot” and “cold” spots.
By tracking the movement of a visitor’s eyeballs based on fixation length and the frequency of how many times a picture was glanced at by a visitor.
Uses of eye-tracking heatmaps:
- Understand where people are looking for information the most on your website.
- Understand whether any element (visual or textual) on the page is diverting visitors’ attention.
- Track visitors’ gaze patterns to ensure that all vital material and images are placed in the most appealing portions of the page.
Assist businesses in making data-backed modifications to their website that match user expectations.
Eye-tracking heatmaps are particularly good for determining how engaging specific visuals on a page are.
What is Mouse Parker?
There are some visitors to the websites are called "Mouse parkers".
Parkers are visitors who keep their cursor in the same place no matter what they are reading.
‘Mouse Parkers’ causes data pollution and reduces segmenting based on time spent.
In this manner, you only include information from visitors and people who read the post.
Also, it reduces the potential of data pollution caused by parkers.
Using website heatmap in combination with other tools to gain more insight
Sometimes you need more information on how to increase the user experience.
Also, combine heatmaps with other behavior and feedback tools.
-
A/B testing combined with website heatmaps
Website heatmap and A/B testing go hand in hand: you can use heatmap data to establish a concept for a future split test.
You can also run heatmaps on A/B test variations to gain insight into why page versions are or aren’t successful.
-
Website heatmaps are combined with session recordings
Website heatmap illustrates data from page visits in collective, session recordings are made for specific users and show their behaviors over numerous pages.
Session recordings replicate a visitor’s activities on a website.
It replays visitors’ interactions on your website such as clicks, taps, scrolls, and keystrokes from visitors' perspectives.
Rather than making assumptions about the clicking, tapping, and/or scrolling you observe on a heatmap, look at some session recordings to understand how your users interact with your site.
-
Heatmap combined with on-page feedback
Utilize heatmaps to define design issues and opportunities on your webpage.
Then, request feedback from your visitors to learn why they aren't finding what they are looking for, what they require, or what you can do to improve their experience.
-
Heatmaps combined with traditional analytics
Traditional web analytics tools will provide you with quantitative data and information on traffic and usage patterns.
Yet numbers, as well as charts, will not answer questions about what visitors want from your site.
Determine why some of your metrics occur by integrating standard analytics with heatmaps.
Create a heatmap, go through the heatmaps analysis checklist, and start looking for what’s causing users to stumble.
Conclusion:
Heatmaps cannot solve all your queries over how users interact with your website.
But most of every website owner's problems are solved with analytics and heatmaps.
Heatmap is an investment to every online business and website owner who prioritizes their visitors.
Let us look at the content of why heatmaps are important for every website owner:
- What is the website Heatmaps?
- Why use a website Heatmap?
- How to create a Website Heatmap?
- Types of Website Heatmap
- What is Mouse Parker?
- Using website heatmap in combination with other tools to gain more insight
ReplayBird - Driving Revenue and Growth through Actionable Product Insights
ReplayBird is a digital experience analytics platform that offers a comprehensive real-time insights which goes beyond the limitations of traditional web analytics with features such as product analytics, session replay, error analysis, funnel, and path analysis.
With Replaybird, you can capture a complete picture of user behavior, understand their pain points, and improve the overall end-user experience. Session replay feature allows you to watch user sessions in real-time, so you can understand their actions, identify issues and quickly take corrective actions. Error analysis feature helps you identify and resolve javascript errors as they occur, minimizing the negative impact on user experience.
With product analytics feature, you can get deeper insights into how users are interacting with your product and identify opportunities to improve. Drive understanding, action, and trust, leading to improved customer experiences and driving business revenue growth.