Have you ever wondered what's really happening behind the scenes of your applications? How do you pinpoint performance issues, diagnose errors, and troubleshoot bottlenecks in a distributed system? How can you make informed decisions to improve your application's performance and user experience?
OpenTelemetry is a powerful observability framework that can help you answer these questions and more. It provides a standardized way of collecting, processing, and exporting telemetry data from your applications, services, and infrastructure.
OpenTelemetry can revolutionize the way you monitor and debug your applications. OpenTelemetry has a wide range of language and platform support, making it easy to integrate with your existing stack.
Let us dive deeper into what OpenTelemetry is and how it benefits?
- What is OpenTelemetry?
- Integrating OpenTelemetry with different services
- OpenTelemetry and other observability tools
- Benefits of OpenTelemetry
What is OpenTelemetry?
OpenTelemetry is a tool that enables developers to monitor and gain insights into their application's performance by gathering and storing data on various aspects of the application, including its resource usage, performance, and errors.
OpenTelemetry is a merger of two open-source projects, OpenCensus and OpenTracing. The project is maintained by the Cloud Native Computing Foundation (CNCF). The main goal of OpenTelemetry is to standardize observability practices across the industry and make it easier for developers to understand and optimize the performance of their applications.
OpenTracing vs OpenTelemetry
The primary distinction between OpenTracing and OpenTelemetry lies in their scope and functionality. OpenTracing focused on distributed tracing, providing a standard API for instrumentation, while OpenTelemetry expanded this by incorporating tracing, metrics, and more, aiming to create a unified and comprehensive observability framework.
As of the convergence and continuation of efforts, OpenTelemetry represents a more inclusive and robust approach to observability, combining both tracing and metrics under one project, developing broader community collaboration and offering a more complete set of tools for understanding system behaviors.
Both OpenTracing and OpenTelemetry played significant roles in advancing observability, with OpenTelemetry representing a more evolved and encompassing framework for telemetry data collection and analysis.
OpenTelemetry Components
OpenTelemetry is an open source observability framework used for collecting, processing, and exporting telemetry data (metrics, traces, and logs) from various systems and applications. Its main components include:
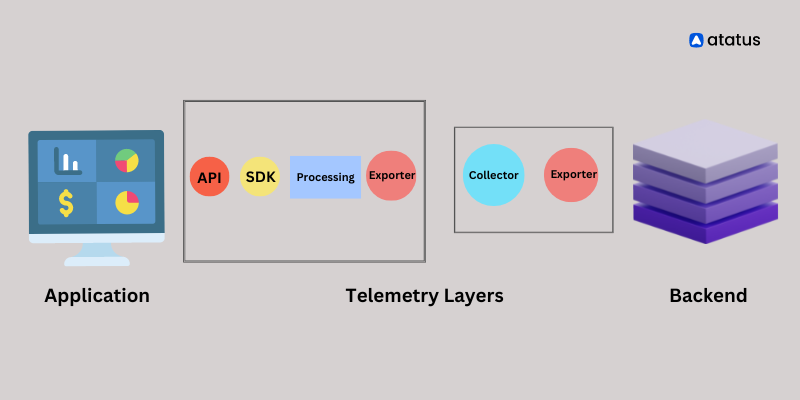
Instrumentation Libraries: OpenTelemetry provides instrumentation libraries for different programming languages such as Java, Python, Go, .NET, Node.js, and more. These libraries help developers to easily instrument their applications and collect telemetry data.
SDKs: OpenTelemetry SDKs provide the infrastructure needed to collect, process, and export telemetry data. They are responsible for managing the telemetry data and exporting it to the desired backend.
Collector: The collector is responsible for receiving telemetry data from the SDKs and forwarding it to the desired backend. The collector can also be used to transform, enrich, and filter the telemetry data. The Collector has three components, namely the receiver, the processor, and the exporter.
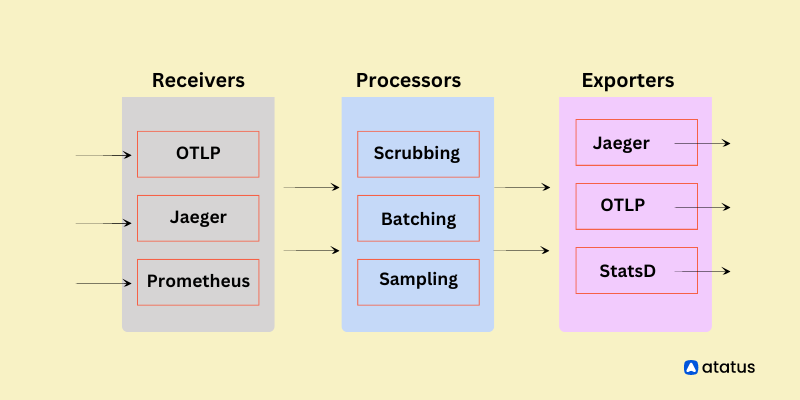
i) Receivers: The receiver is responsible for determining how data is collected, which can be done through either a push model where data is regularly sent to the Collector, or a pull model where data is only gathered when queried. The receiver can also gather data from multiple sources.
ii) Processors: The main purpose of the processor is to transform, filter, and enhance the incoming data in a way that is suitable for the target backend system. OpenTelemetry provides several built-in processors that can be used out of the box, such as the batch processor for batching data, the attribute processor for adding metadata, and the filter processor for excluding specific data based on certain conditions.
iii) Exporters: The exporter is responsible for sending telemetry data from the collector to a backend system. The exporter receives the telemetry data that has been processed by the collector and formats it in a way that is suitable for the target backend system. This can involve converting the data into a specific format, such as JSON or protobuf, and adding any required metadata or tags. The exporter can be configured to use either a push or pull model for sending data to the backend.
OpenTelemetry Protocol (OTLP): OTLP is a standard protocol used for transmitting telemetry data between the SDKs, collectors, and exporters. It ensures interoperability between different components of the OpenTelemetry framework. It supports different types of telemetry data, including OpenTelemetry traces, OpenTelemetry metrics, OpenTelemetry analytics and OpenTelemetry logs.
Overall, these components work together to provide a unified and standardized way of collecting, processing, and exporting telemetry data, making it easier to observe and troubleshoot complex distributed systems.
OpenTelemetry: Metrics vs Traces vs Logs
OpenTelemetry covers three fundamental types of data for observability: metrics vs traces vs logs.
-
OpenTelemetry Metrics: Lets say OpenTelemetry metrics as a way to measure and monitor the health and performance of your systems over time. They're like the vital signs of your application. OpenTelemetry Metrics provide quantitative data about various aspects such as CPU usage, memory consumption, request rates, error rates, etc. They help you understand trends, identify patterns, and detect anomalies.
-
OpenTelemetry Traces: They offer a detailed view of how requests travel through different components of your application. It's like tracing a journey, step-by-step. OpenTelemetry Traces provide insights into the flow of requests, showing where time is spent, which services are involved, and any bottlenecks encountered along the way. This helps in diagnosing performance issues, optimizing the code, and understanding dependencies within a distributed system.
-
OpenTelemetry Logs: Logs are like a storybook of events and messages generated by your application or system. They contain detailed information about specific occurrences, errors, warnings, user activities, and more. OpenTelemetry Logs are invaluable for troubleshooting, debugging, and auditing purposes. They provide context and help developers understand the sequence of events leading up to an issue.
Integrating OpenTelemetry with Different Services
Integrating OpenTelemetry with different services is an essential part of using OpenTelemetry effectively. By integrating with different services, you can collect telemetry data from various sources and platforms and have a more comprehensive view of your application's performance and health. Here are some services you can understand how OpenTelemetry work with integration,
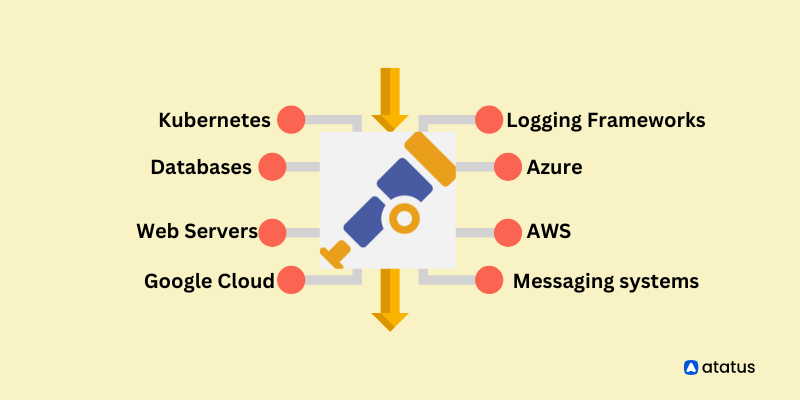
- Kubernetes: OpenTelemetry can be integrated with Kubernetes to collect telemetry data from your Kubernetes clusters, including data from containers, nodes, and other Kubernetes objects. This integration can help you monitor your Kubernetes environment and troubleshoot issues more effectively.
- AWS: OpenTelemetry can be used to collect telemetry data from AWS services such as Lambda, EC2, and Elastic Beanstalk. This AWS OpenTelemetry integration can help you monitor your AWS infrastructure and identify performance issues.
- Azure: OpenTelemetry can be integrated with Azure services such as App Service, Functions, and AKS to collect telemetry data. This integration can help you monitor your Azure environment and identify issues.
- Google Cloud Platform: OpenTelemetry can be integrated with Google Cloud Platform services such as Cloud Functions, Cloud Run, and Kubernetes Engine to collect telemetry data. This integration can help you monitor your GCP environment and troubleshoot issues.
- Databases: OpenTelemetry can be used to collect telemetry data from databases such as MySQL, PostgreSQL, and MongoDB. This integration can help you monitor the performance of your database queries and identify issues.
- Messaging systems: OpenTelemetry can be used to collect telemetry data from messaging systems such as Kafka and RabbitMQ. This integration can help you monitor message throughput, latency, and errors.
- Web servers: OpenTelemetry can be integrated with web servers such as Nginx and Apache to collect telemetry data. This integration can help you monitor web server performance and troubleshoot issues.
- Logging frameworks: OpenTelemetry can be integrated with logging frameworks such as Log4j and Logback to collect telemetry data. This integration can help you monitor application logs and identify issues.
OpenTelemetry and Other Observability Tools
OpenTelemetry is a powerful observability tool, but it is not the only tool available. It can work alongside other observability tools to provide a more comprehensive view of your application's performance and health. Here are some examples of how OpenTelemetry can complement other observability tools:
- Metrics systems: Metrics systems such as Prometheus and Graphite can be used to collect and visualize metrics data, while OpenTelemetry can be used to collect and transmit telemetry data from different sources. OpenTelemetry can provide additional context for the metrics data, helping you identify the root cause of issues more quickly.
- Logging frameworks: Logging frameworks such as Log4j and Logback can be used to collect and store application logs, while it can be used to provide additional context for the OpenTelemetry logs, such as tracing information and performance metrics. This can help you troubleshoot issues more quickly and reduce the time it takes to identify and fix issues.
- Tracing tools: Tracing tools such as Jaeger and Zipkin can be used to trace transactions across distributed systems, while OpenTelemetry can be used to instrument your application code to collect tracing data. This can provide a more comprehensive view of your application's performance and help you identify issues more quickly.
- APM tools: Application Performance Monitoring (APM) tools such as Atatus can be used to monitor application performance, while OpenTelemetry can be used to collect telemetry data from different sources. This can provide a more comprehensive view of your application's performance and help you identify performance issues more quickly.
- Incident response tools: Incident response tools such as PagerDuty and VictorOps can be used to notify teams of issues and incidents, while OpenTelemetry can be used to provide additional context for the incidents, such as performance metrics and tracing information. This can help teams respond to incidents more quickly and reduce the time it takes to resolve issues.
Benefits of OpenTelemetry
OpenTelemetry benefits developers and operators, helping them see through the complexities of their distributed systems. It's all about making deveopment easier by giving them the power to manage and boost the performance, reliability, and scalability of their applications.
- Standardized APIs: OpenTelemetry offers a set of APIs for different languages and platforms, providing a consistent and standardized way to instrument applications.
- Distributed tracing: OpenTelemetry allows you to trace transactions across distributed systems, giving you visibility into the entire request flow and helping you identify performance bottlenecks.
- Integration with other tools: OpenTelemetry can integrate with other observability tools, such as tracing and logging systems, making it easy to get a holistic view of your applications' performance.
- Reduced debugging time: With OpenTelemetry, you can easily trace requests across different services, which can help you quickly identify the root cause of errors and reduce your debugging time.
- Increased efficiency: OpenTelemetry allows you to monitor your applications in real-time, which can help you quickly identify performance issues and optimize your application's resource utilization.
- Security: OpenTelemetry provides secure communication protocols and supports encryption and authentication, ensuring that your telemetry data remains secure.
- Cost savings: OpenTelemetry can help you optimize your application's performance and reduce resource utilization, which can translate into cost savings, especially for cloud-based applications.
Conclusion
OpenTelemetry is an observability framework that provides a standardized way of collecting, processing, and exporting telemetry data from your applications, services, and infrastructure. In this blog, we've explored some of the key features and benefits of OpenTelemetry.
Another important OpenTelemetry benefit is its support for metrics, traces and logs. Metrics can give you a high-level view of your system's performance and behaviour, while logs can provide detailed information about specific events and errors.
ReplayBird - Driving Revenue and Growth through Actionable Product Insights
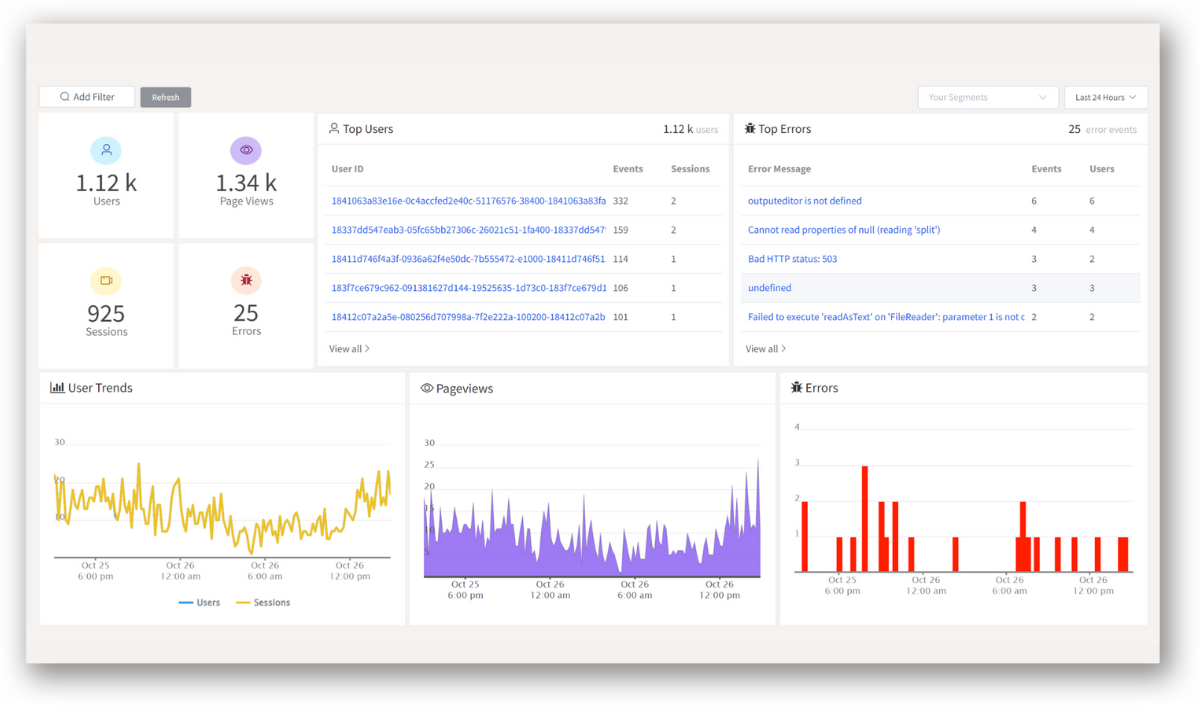
ReplayBird is a digital experience analytics platform that offers a comprehensive real-time insights which goes beyond the limitations of traditional web analytics with features such as product analytics, session replay, error analysis, funnel, and path analysis.
With Replaybird, you can capture a complete picture of user behavior, understand their pain points, and improve the overall end-user experience. Session replay feature allows you to watch user sessions in real-time, so you can understand their actions, identify issues and quickly take corrective actions. Error analysis feature helps you identify and resolve javascript errors as they occur, minimizing the negative impact on user experience.
With product analytics feature, you can get deeper insights into how users are interacting with your product and identify opportunities to improve. Drive understanding, action, and trust, leading to improved customer experiences and driving business revenue growth.
Try ReplayBird 14-days free trial
Further Readings:
 Afra
Afra Afra
Afra Uma
Uma